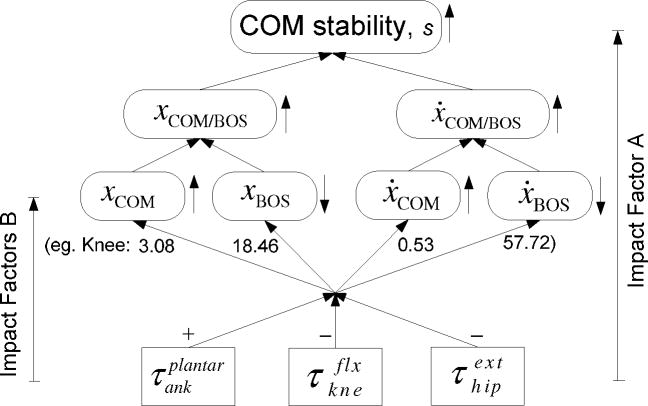
Fig. 6.
Causal diagram shows the change in the joint moments of the stance (right) limb and the resulting change in the center of mass (COM) stability (Δs), each quantified by Impact factor A, and measured at the end of the single-stance phase corresponding to a per unit change in the joint moments during this phase. The solid line indicates the impact of the variable at the tail end of the arrow on the variable at the head of the arrow based on the forward-dynamics formulation. The diagram also shows the impact of these moments on four state variables consisting of the position and velocity of the center of mass (COM, xCOM and ẋCOM) and of the base of support (BOS; xBOS and ẋBOS) as Impact Factors B. An arrow “↑” or “↓” respectively implicate the increment or decrement in these variables and in their composite variables, xCOM/BOS and ẋCOM/BOS, that leads to an increase “↑” in the stability. The sign “+” or “−” indicates that the effort caused by an increase in the optimally-matched moment profile shown in Fig two on the change in these four state variables. For example, “−”indicates that one unit of increase in the knee flexor moments causes a reduction in all these four variables by the amount indicated by the corresponding numbers which were averaged across 10 subjects.

