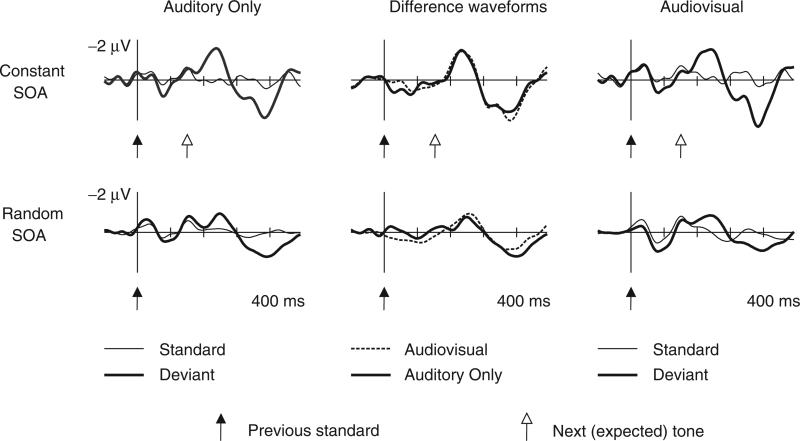
Figure 1.
Grand–averaged (N=13) frontal (Fz) ERP responses elicited by the test tones (thin lines) and tone omissions (thick lines) in all four experimental conditions: constant-SOA in the top row, random-SOA in the bottom row, auditory-only in the left column, and audiovisual in the right column. The deviant-minus-standard (omission-minus-tone) difference waveforms are shown in the central column. The difference waveforms are overplotted for the auditory-only (continuous line) and audiovisual conditions (dashed line), separately for the constant-SOA and the random-SOA conditions. The zero time point coincides with the delivery of a tone (standard) or the delivery of the tone preceding the omission (deviant). For the constant-SOA condition, the time of the delivery of the next tone (expected time of delivery of the omitted tone) is marked with empty arrows (the time of delivering the next tone varies in the random-SOA condition).

