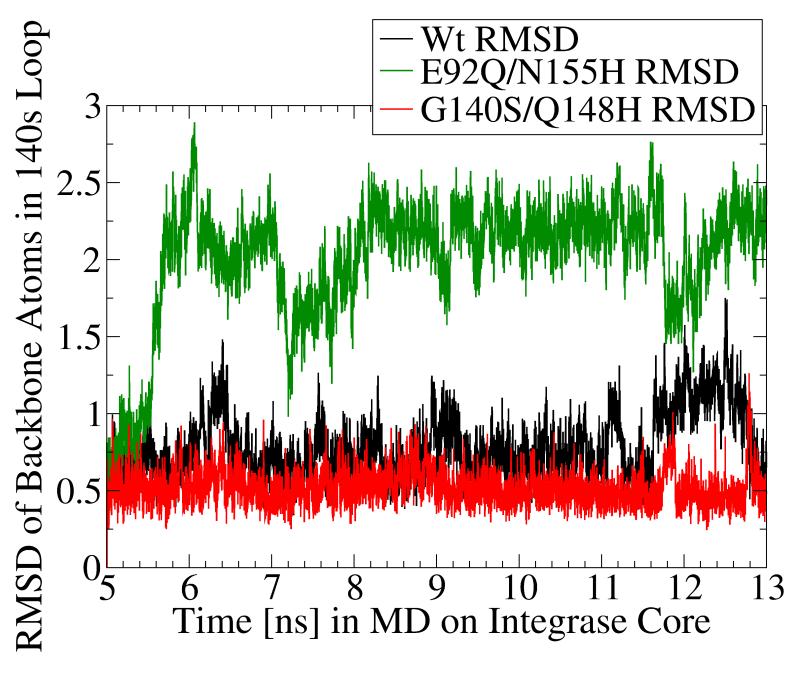
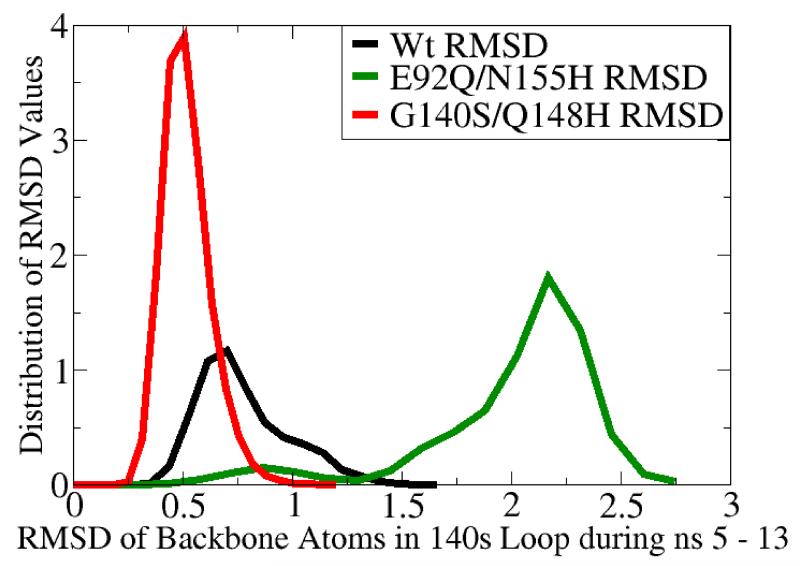
Fig. 5.
MD simulation of the G140S/Q148H raltegravir-resistant mutant displayed significantly dampened dynamics of the flexible 140s loop. In panels a and b, the Root-Mean-Square-Deviation (RMSD) displayed by the backbone atoms of the flexible 140s loop (i.e., Gly140 - Gly149) during MD simulations of the wild type (in black), the E92Q/N155H mutant (in green), and the G140S/Q148H mutant (in red) are presented. The segment of MD from the fifth to the thirteenth nanosecond is displayed, but the same trends were observed throughout the entire MD simulations. RMSD data indicate the amount of structural variation displayed in each and every conformation with respect to a reference state (i.e., to the first input structure in this segment of MD on each system, which is defined as having an RMSD = 0.0). Panel a presents the trajectory of these RMSD values, while panel b displays histograms of the relative distributions of the different RMSD values present in the 8,000 conformations corresponding to this 8 ns section of MD. The three systems displayed the following RMSD trends in ns 5-13: the wild type system displayed an average RMSD value of 0.776, with a maximum of 1.751 and a standard deviation of 0.209. The E92Q/N155H mutant system displayed an average RMSD value of 2.005, with a maximum of 2.891 and a standard deviation of 0.404, while the G140S/Q148H mutant displayed an average RMSD of 0.519, with a maximum of 1.263 and a standard deviation of 0.110.


