
Figure 3.
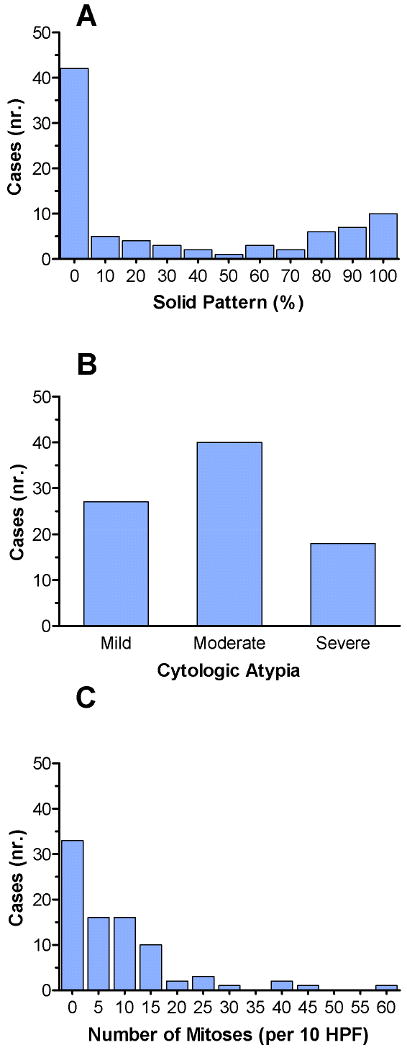
Distribution of cases based on the individual histologic characteristics. (A) There is a bimodal distribution of cases based on solid pattern, with the highest number of cases having either no solid component or entirely solid component. (B) Distribution of cases based on cytologic atypia. Twenty-seven cases (31.8%) had mild cytologic atypia, 40 cases (47.1%) had moderate cytologic atypia, and 18 cases (21.2%) had severe cytologic atypia. (C) Distribution of cases based on the number mitoses per 10 HPF. The mean number of mitoses/10 HPF was 8.6.