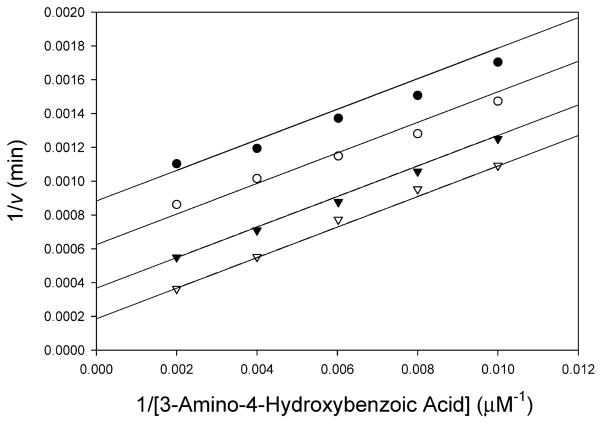
Figure 1.
Bisubstrate kinetic analysis of TBNAT. The initial velocity of acetyl transfer was measured in 50 mM Tris (pH 7.7) with varying concentrations of AHB (100–500 μM) and fixed concentrations of AcCoA: 50 (●), 75 (○), 150 (▼), and 500 μM (▽). Shown is the double-reciprocal plot of the initial velocity as a function of AHB concentration. Global fitting of the data to eq 2 (solid lines) gave a kcat of 154 ± 13 s−1, a KAcCoA of 0.358 ± 0.04 mM, and a KAHB of 0.836 ± 0.09 mM.

