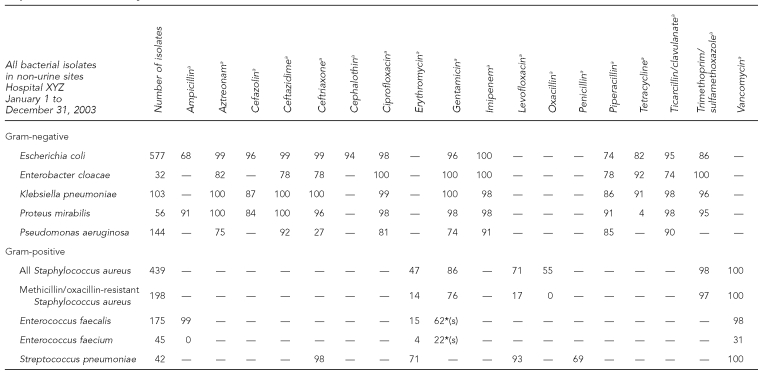
Figure 1.
Example (fictitious data) of a cumulative hospital antibiogram submitted by clinical laboratories to the Michigan Department of Community Health, 2000–2005
aValue indicates percent susceptible for each organism-antimicrobial combination. Percent susceptible was generated by including the first isolate of that organism encountered on a given patient.
— = Drug not tested or not indicated
*(s) = Synergy with cell-wall agent; do not use alone

