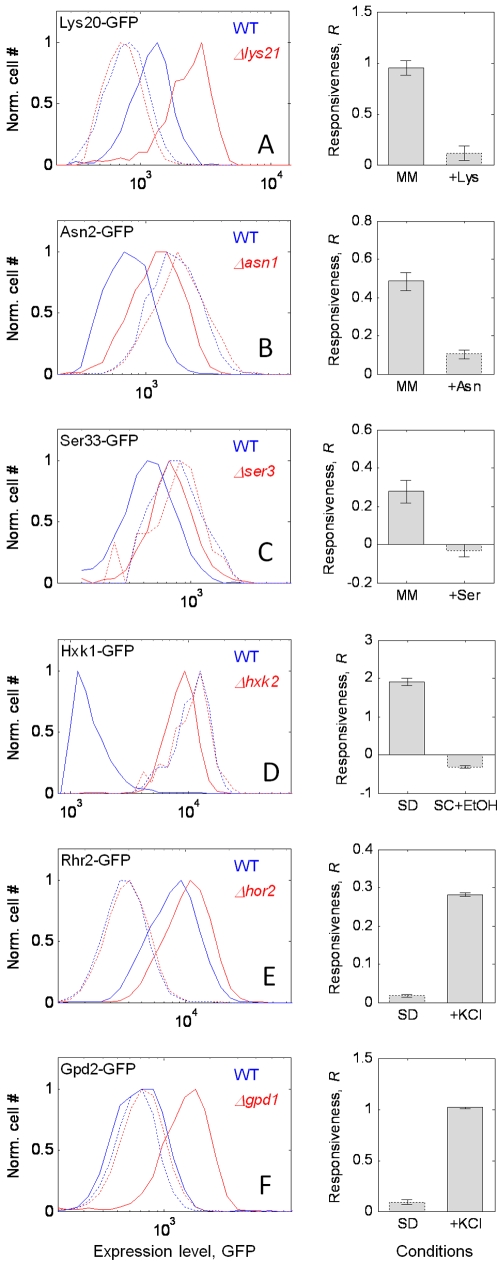
Figure 5. Responsiveness of a protein to deletion of its paralog is eliminated or created by removing or generating a need for its function.
(A–F) Left: histogram of expression of a gene X1-GFP in the wild-type background (blue) and the paralog-deletion background (red). The protein fusions are (A) Lys20-GFP, (B) Asn2-GFP, (C) Ser33-GFP, (D) Hxk1-GFP, (E) Rhr2-GFP, and (F) Gpd2-GFP; histograms are shown for conditions in which the gene function is needed (solid lines) or unneeded (dashed lines). The total cell number in each sample was normalized (Norm. cell #). Right: responsiveness, R, of the focal gene in the needed (left bar) or unneeded (right bar) environments: MM, minimal medium; SD, synthetic complete dextrose medium; SC+EtOH, synthetic complete ethanol medium. Responsiveness and histograms reflect the median responsiveness value of three to 11 replicate experiments. Error bars indicate standard error of the mean.

