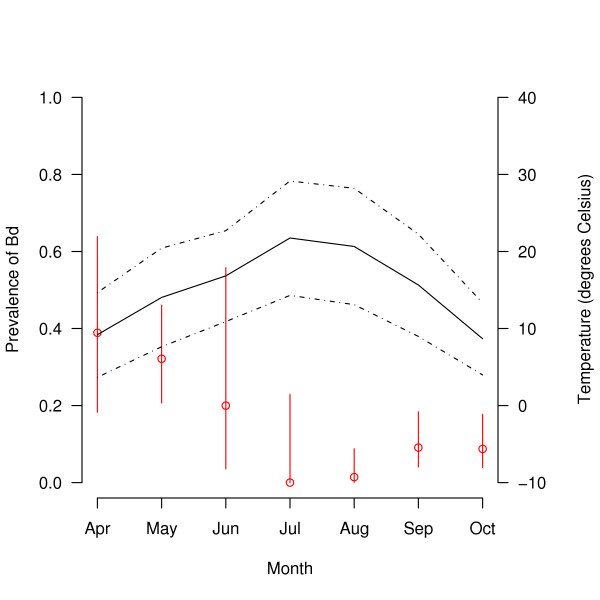
Figure 3.
Prevalence of Bd versus the mean monthly temperature. The prevalence of Bd in R. pipiens changes across the 7 months of sampling. The red circles show the mean prevalence of Bd for each month and the red lines indicate the 95% confidence limits. The solid and dotted black lines show the mean, mean maximum, and mean minimum air temperatures for each month (in °C; averaged for 2003, 2005, 2006 and 2007). Captures are pooled across the three tissue sampling methods (bag rinses, toe clips, and swabs), the three stage classes (young of the year, juveniles, and adults), the four years (2003, 2005, 2006, and 2007), and the two locations (CVWMA, BFWMA).

