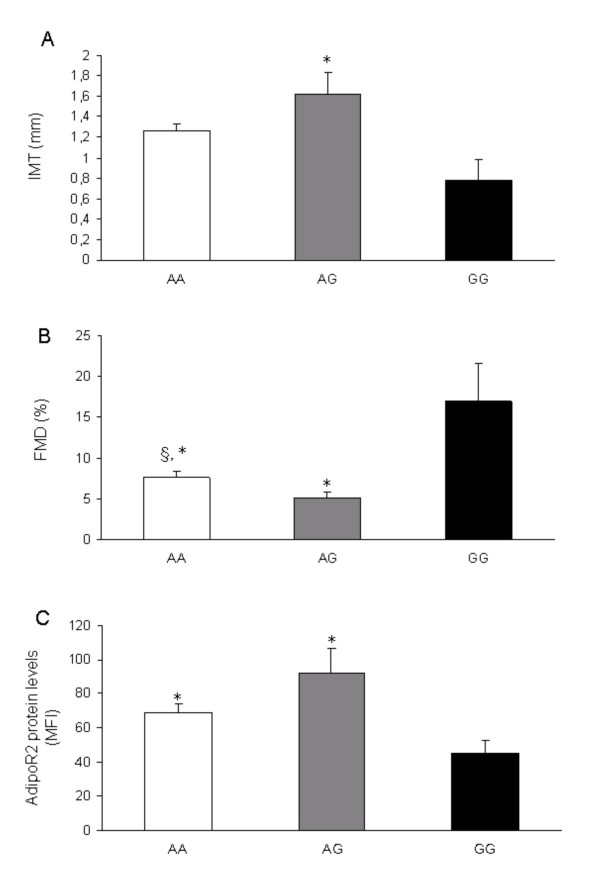
Figure 4.
Genotype effects of the SNP 767870 of ADIPOR2 on the: (A) IMTbulb measurement, (B) FMD measurement and (C) ADIPOR2 protein levels from CD14+ monocytes. Data are means ± SEM. Differences between genotype groups were analysed by ANOVA adjusted for age, sex, BMI, WHR and HOMA (A and B, p = 0.04 and p = 0.002 respectively) and ANOVA adjusted for age, sex, WHR and HOMA (C, p = 0.05) * p < 0.05 vs GG homozygotes §p < 0.05 vs AG heterozygotes.

