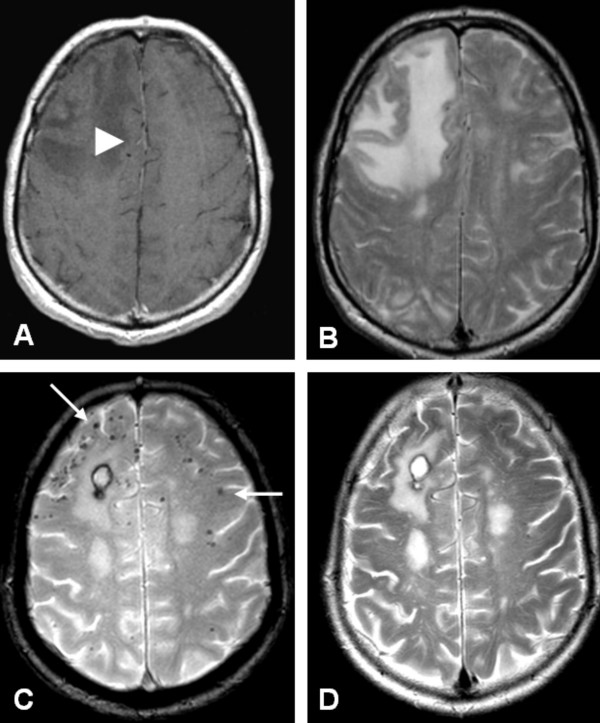
Figure 1.
Axial MRI at presentation (A, B) and 3 months after treatment (C, D). A) Contrast enhanced, T1- weighted image shows low signal intensity of the right frontal lobe with minimal enhancement of the white matter (white arrowhead). B) T2-weighted image shows high signal intensity in the right frontal lobe. C) Gradient echo sequence shows subcortical 'black dots', consistent with microbleeds (white arrows), and a small postoperative hematoma after biopsy. D) T2-weighted image after treatment shows a decrease of high signal intensity in the right frontal lobe.

