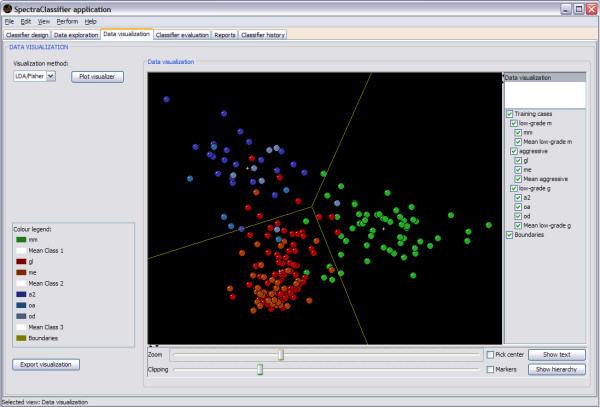
Figure 8.
Data visualisation tab. Continuing the example of Figure 4, the projection space of the Fisher LDA classifier can be seen: low-grade m (mm, in green), aggressive (gl+me, in shades of red) and low-grade g (a2+oa+od, in shades of blue). This visualisation is a two-dimensional representation of the corresponding point in the space of each case, taking advantage of this visualisation by rotating it and twisting it around (using the mouse and the controls at the bottom of the visualisation panel), turning on or off parts of the display (using the check buttons components in the right of the visualiser), and identifying cases by selecting them with the mouse. As this example is a three-class classifier, a 2D display with the boundaries of the classes (yellow lines) is displayed.

