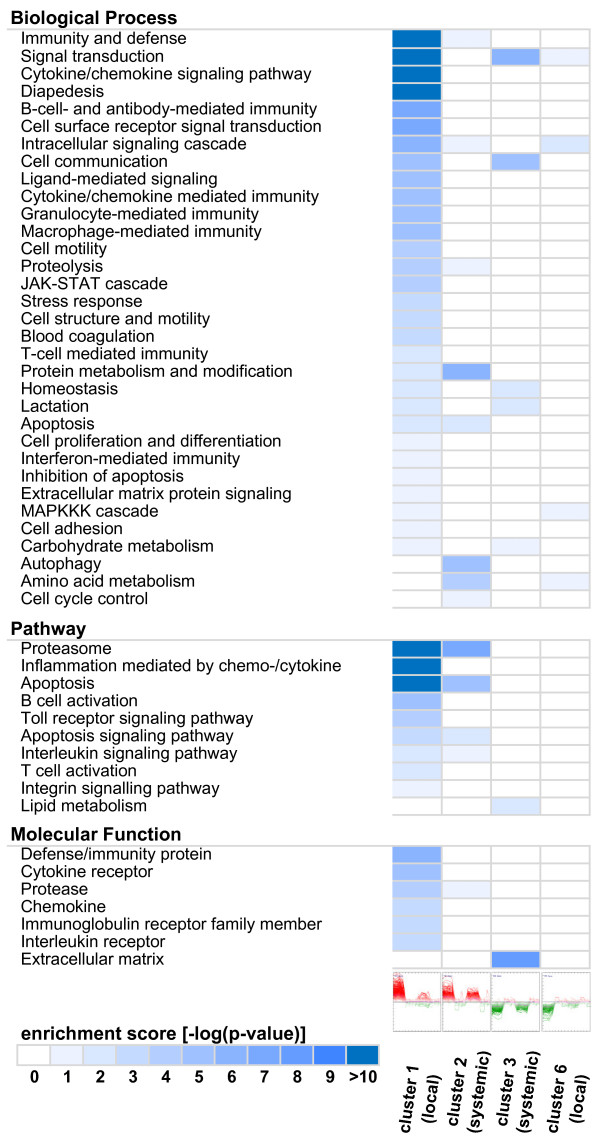
Figure 5.
Gene Ontology and pathway enrichment of clusters. The genes constituting the clusters in Figure 4 were subjected to enrichment analysis using the Pantherdb gene expression tool and the CoPub keyword enrichment calculator. Biological processes, pathways and molecular functions that were significantly enriched (adjusted p-value < 0.05) in at least one cluster are shown as a heatmap. P-values are color coded ranging from white for non-significant results to blue colors saturating with increasing significance. Rows indicate the enriched terms and columns the p-values of the respective clusters. Clusters 4 and 5 did not yield any significant enrichment and were omitted.

