
Figure 3.
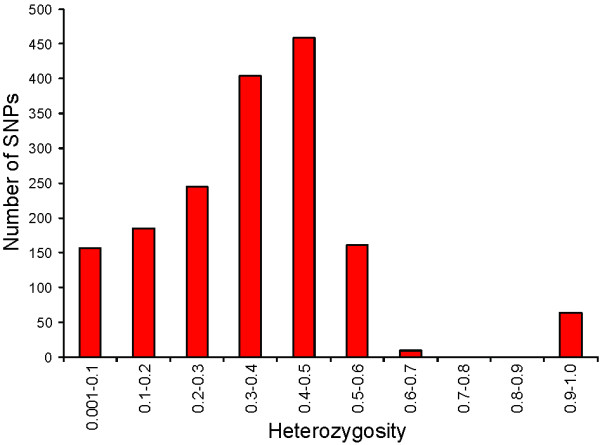
Observed heterozygosity for polymorphic SNPs in four Canadian populations. SNPs were grouped into categories based on their values for observed heterozygosity averaged across four Canadian populations. All polymorphic SNPs were analysed, including those with high values for observed heterozygosity (predicted duplicates). The number of SNPs falling into each category is shown.