
Figure 4.
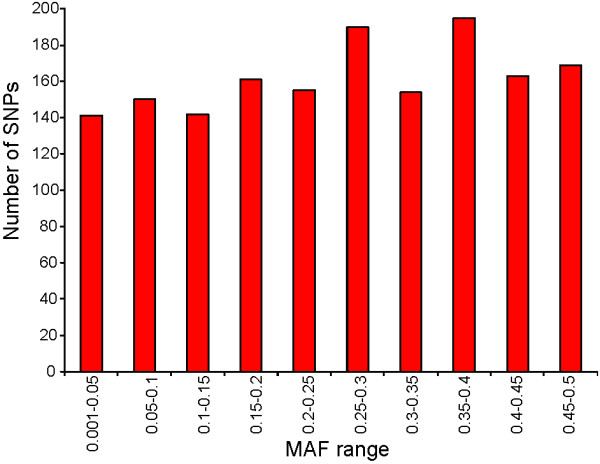
Minor allele frequency of validated SNPs in four Canadian populations. SNPs were grouped into categories based on their minor allele frequency (MAF) averaged across four Canadian populations. Only the validated SNPs have been included in this analysis, with the number of SNPs falling into each MAF category shown.