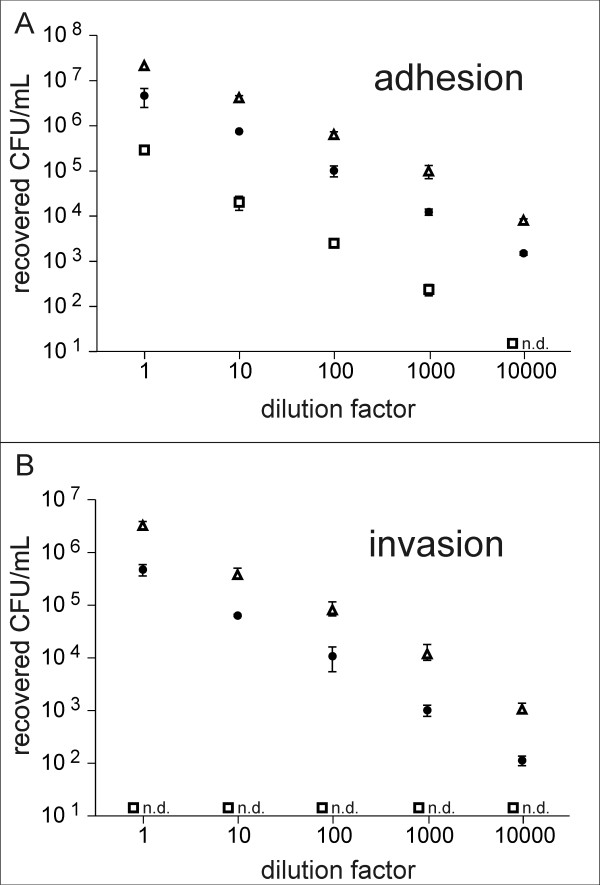
Figure 1.
Dose response analysis of S. gallolyticus adhesion to and invasion of EA.hy926 cells. (A) Adhesion, (B) Invasion. Cells were incubated with decreasing concentrations of three different S. gallolyticus strains (white triangle: isolate 05950, black dot: isolate 21702, white square: DSM 16831), as described in Material and Methods. Error bars indicate standard deviations, n.d.: not detectable.

