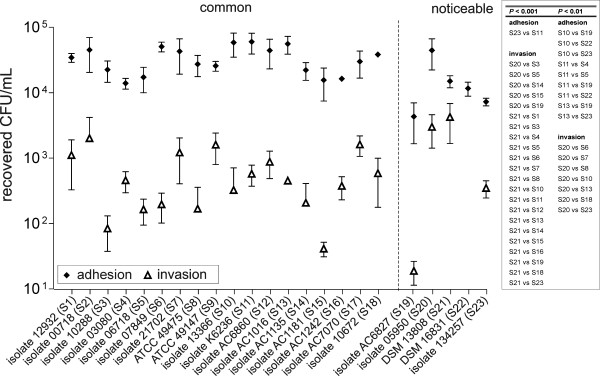
Figure 2.
Adhesion and invasion characteristics of different S. gallolyticus strains to EA.hy926 cells. Displayed are the factorized adhesion to and invasion characteristics of 23 different S. gallolyticus strains (calculated to 1 × 10⁵ CFU/mL) after 2 h infection of EA.hy926 cells. The dashed vertical line indicates the separation of "common" and "noticeable" relations between adhesion and invasion. Error bars indicate standard deviations. Results of statistical analysis of individual strains are arranged in tabular form.

