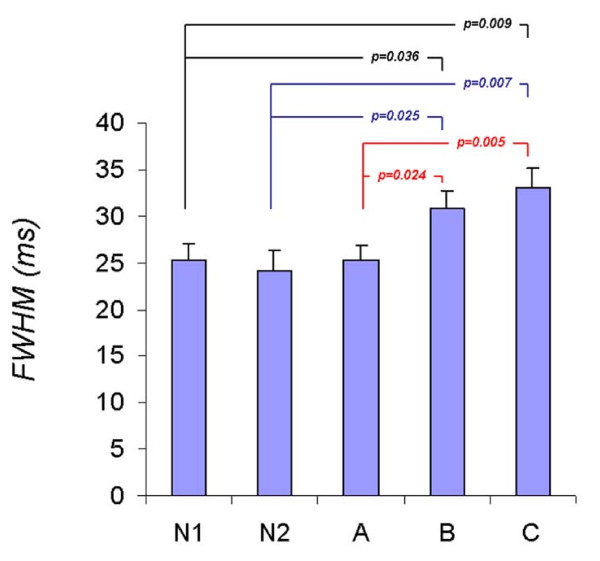
Figure 4.
Graphs of FWHM/Strata. The FWHM of the DMD groups B (age >12 yrs, EF ≤ 55%, |εcc| < 12%) and C (age >12 yrs EF = 55%, |εcc| < 12%) were significantly higher than all other groups including group A (age <12 yrs EF > 55%, |εcc| > 12%) indicating increased heterogeneity in the T2 distribution in DMD with impaired regional and global function.

