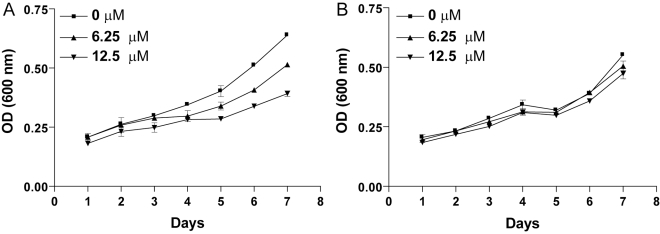
Figure 2. Development of in vitro NFV resistance by direct drug pressure on axenic amastigotes.
(A) Growth curve was determined at the initial seeding. (B) Growth curve was determined after 8 passages. The growth of parasites was followed by measuring the optical density (OD) at 600 nm at the listed days.

