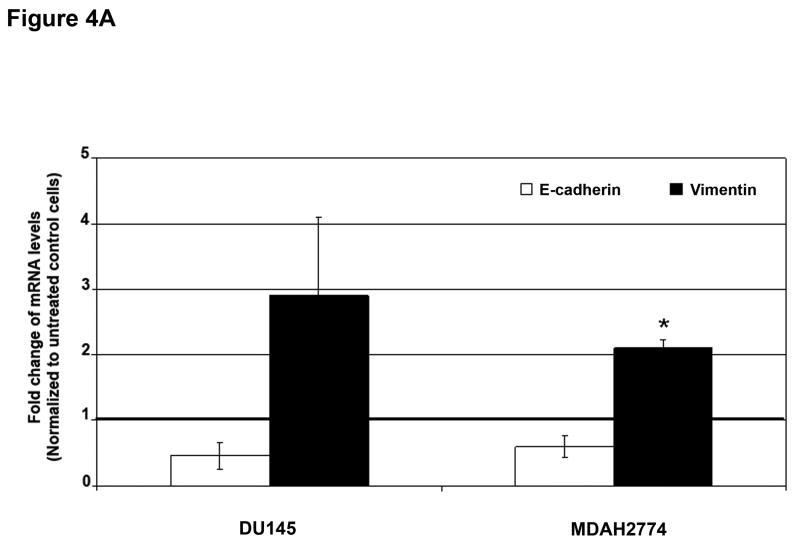
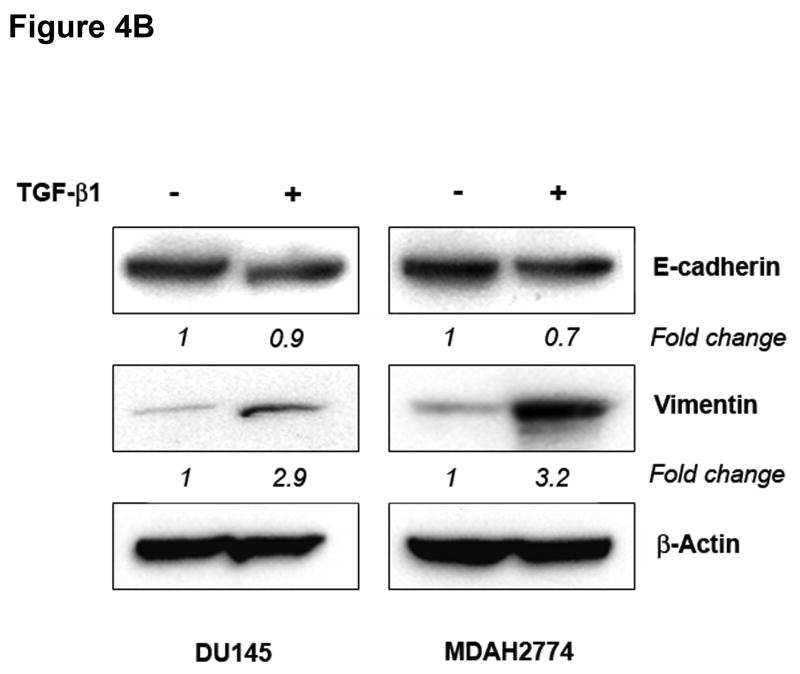
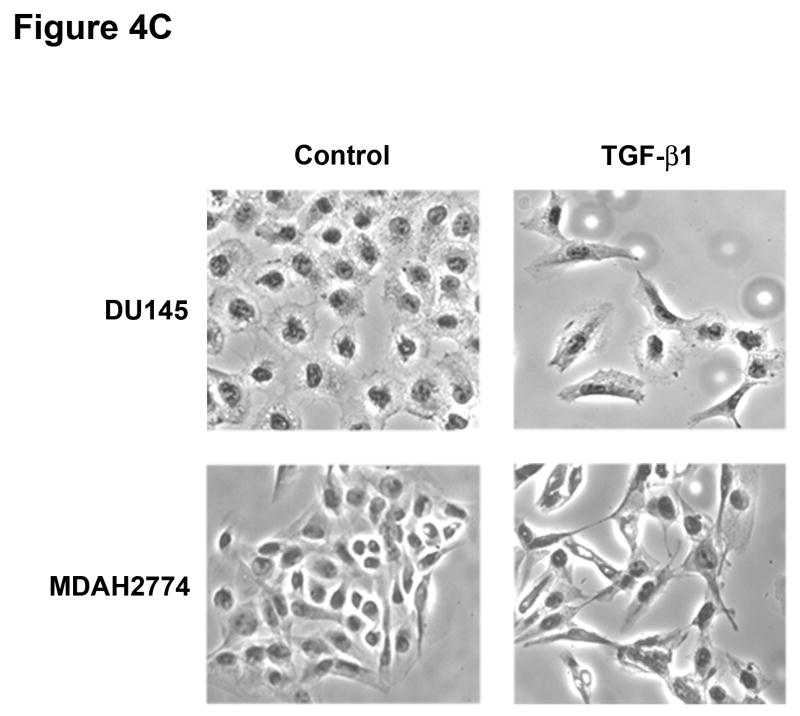
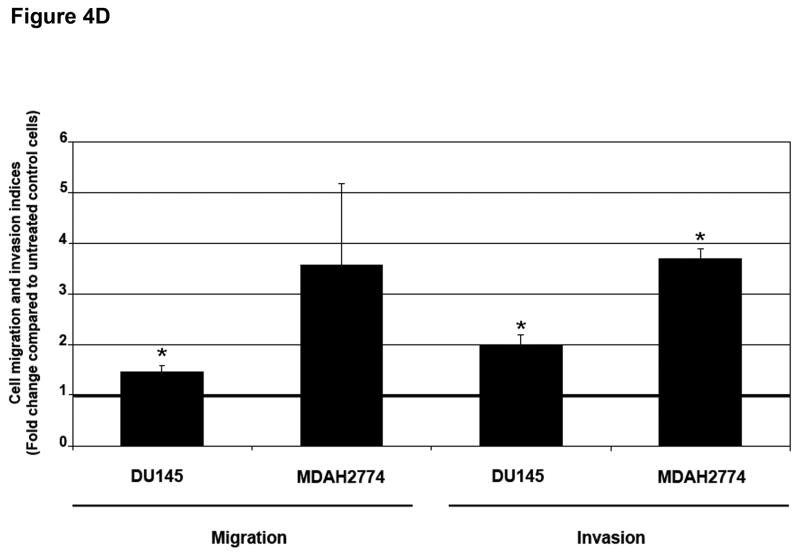
Figure 4. TGF-β 1 induces EMT in MSI cell lines with a wildtype TGFBR2.
A) E-cadherin and vimentin mRNA levels in DU145 and MDAH2774 cell lines after treatment with 10 ng/mL TGF-β1 for 48 hours. The control values are normalized to 1, and the data are expressed as fold change in treated cells. Columns, average of two independent experiments; bars, SEM. *, P<0.05 as compared to control cells. B) The expression of E-cadherin and vimentin was evaluated by Western blot analysis in untreated DU145 and MDAH2774 cells or cells treated with 10 ng/mL TGF-β1 for 48 hours. Densitometry values are expressed as fold change compared with control values normalized to 1. C) Phase-contrast photomicrographs of DU145 and MDAH2774 cells before and after treatment with 5 ng/mL TGF-β1 for 48 hours. D) The migratory behavior of untreated cells and cells treated with 5 ng/mL TGF-β1 for 48 hours was evaluated. The control values are normalized to 1, and the data are expressed as fold change in treated cells. Columns, average of at least three independent experiments; bars, SEM. *, P<0.05 as compared to control cells. E) Cells were transfected with pSBE4-BV/Luc, p3TP-Lux and pRL/CMV constructs and treated with or without 10 ng/mL TGF-β1 for 18 hours. Luciferase activity was then measured. The control values are normalized to 1, and the data are expressed as fold change in treated cells. Columns, average of at least three independent experiments; bars, SEM. *, P<0.05 as compared to control cells. F) DU145 and MDAH2774 cells were treated with 5 ng/mL TGF-β1 and whole cell extracts were analyzed for the indicated primary antibodies.


