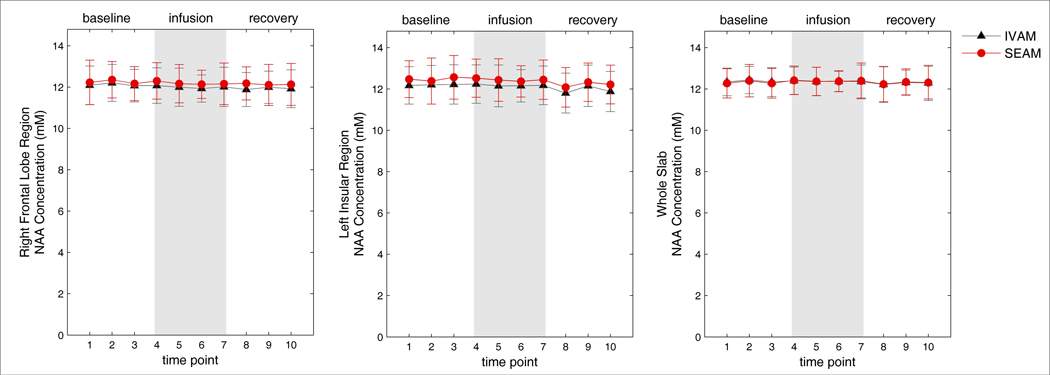
Figure 3.
Concentration estimates for NAA for the IVAM and SEAM methods over the duration of the dynamic infusion experiment for the right frontal lobe region (left), left insular region (middle) and whole slab (right). Mean concentrations over all 18 subjects are shown with error bars indicating the standard deviation across subjects.

