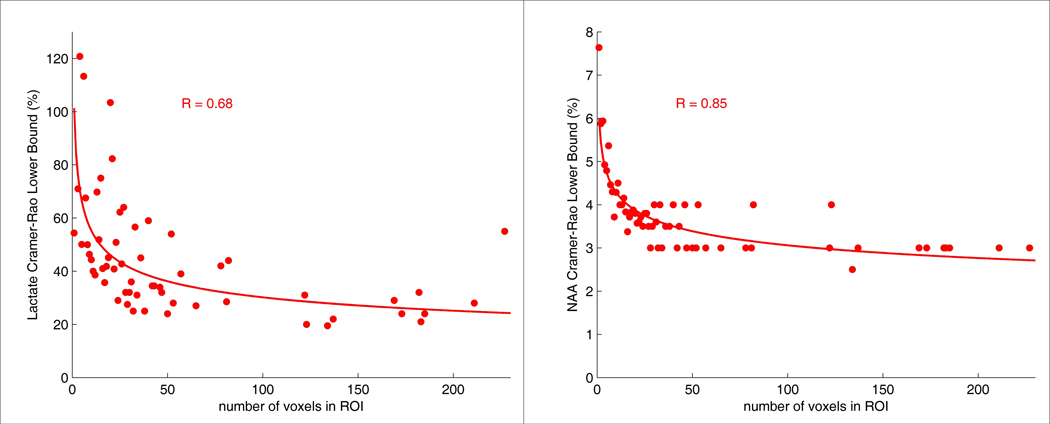
Figure 4.
Average CRLBs across all subjects and all twenty-two brain regions plotted as a function of the number of voxels in the ROI for cerebral lactate (left) and NAA (right) for the SEAM approach. The data corresponds to the last time point of the lactate infusion period. The equations for the SEAM lactate and NAA trend lines are y=101.32*x−0.26 and y=6.00*x−0.15, respectively.

