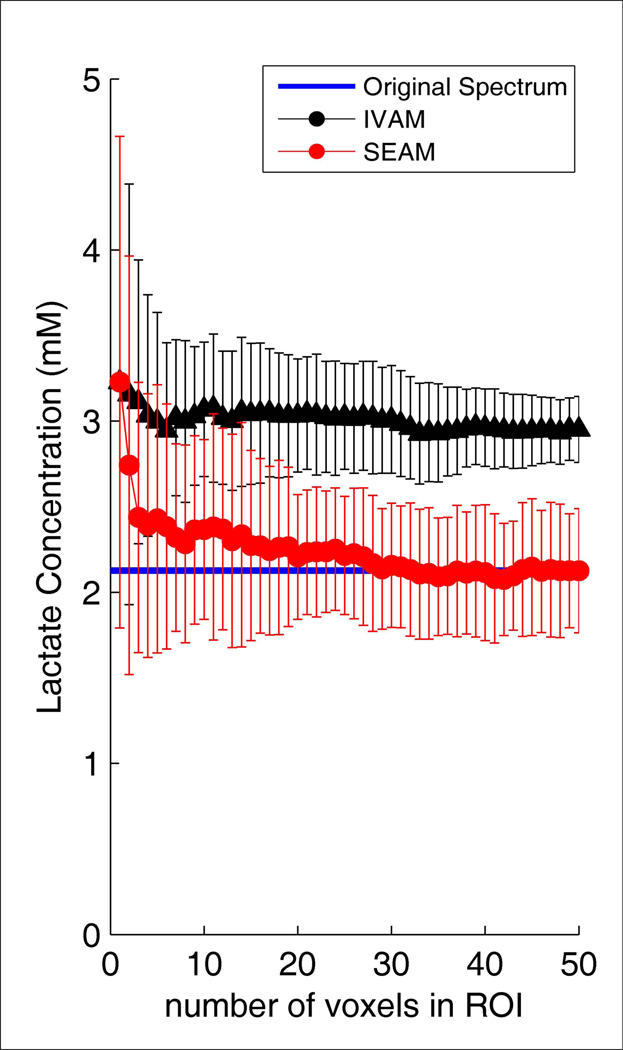
Figure 7.
Lactate concentration estimates as a function of number of voxels in the simulated ROIs for the SEAM and IVAM methods, corresponding to the data presented in Figure 6. The plots show the means and standard deviations across ten experiments, each with a different random noise introduction. A blue line on each plot indicates the value for the original spectrum.

