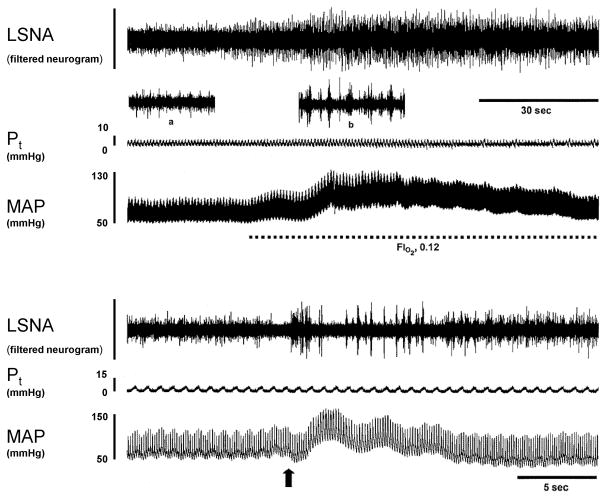
Figure 4.
Physiological records showing typical responses to isocapnic hypoxia (upper panel) and cyanide injection (lower panel). Insets in the upper panel show 4-second segments of neurogram with expanded timebase acquired during baseline (a) and peak response to hypoxia (b). The arrow in the lower panel indicates the timing of the cyanide injection.

