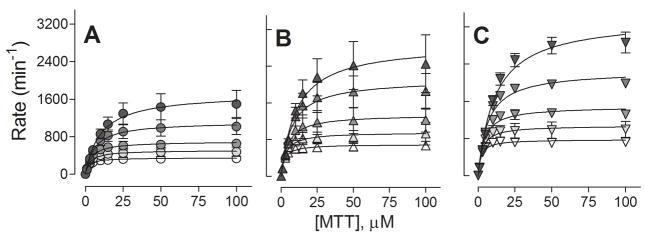
Fig. 4.
Effect of CPR mutation on MTT reduction as function of ionic strength. MTT reduction by wild type (A), D113A (B), and E115/6A (C) was measured with varying concentrations of MTT (1 to 100 μM) as a function of ionic strength for 60 s. Color intensity reflects ionic strength from 10 to 210 mM. The reported values reflect the results from three experiments performed in duplicate and include the standard deviation from mean. The parameters from the fits of the kinetic profiles are summarized in Table 3.

