
Figure 3.
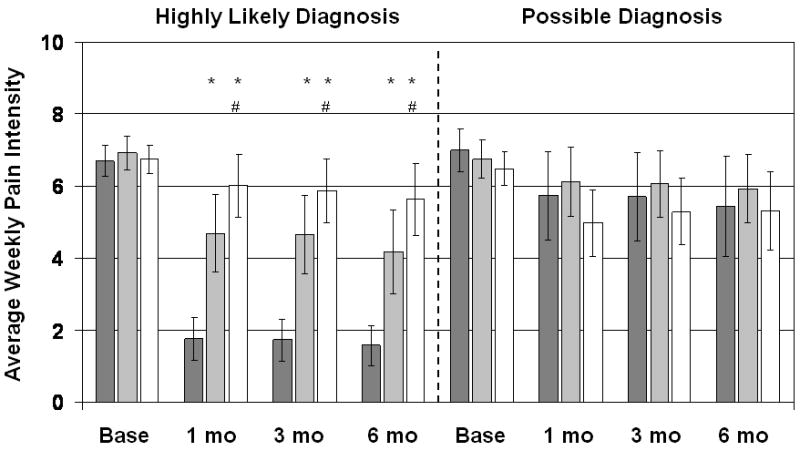
Average of weekly pain intensity rating for previous month. Pain was rated on a 10cm visual analog scale for the worst rectal pain in the previous week. Dark gray bars are Biofeedback-treated patients, light gray bars are EGS-treated patients, and white bars are patients treated with digital massage and Sitz baths. Vertical lines show 95% confidence intervals. Patients with a highly likely diagnosis of LAS are shown separately from patients with only a possible diagnosis. *Significantly different from the Biofeedback group at p<0.025; #significantly different from the EGS group at p<0.025.