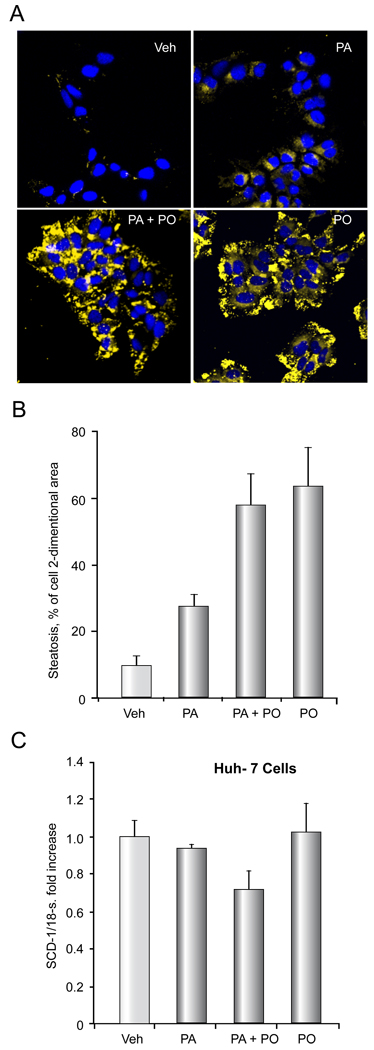
Figure 1. PO does not attenuate PA- mediated steatosis.
Nile red staining was performed on Huh-7 cells treated with vehicle (Veh), 200 µM PA, 200 µM PO plus 200 µM PA, or 200 µM PO alone for 18 h. (A) Representative fluorescent photomicrographs (× 60) are depicted. Nile red fluoresces as a yellow-gold at about 510nm; cells were counter-stained for nucleic acids by DAPI (blue). (B), Cellular steatosis was quantified in 5 random low power fields for each condition with image analysis software. Total area of lipid per cell (pixels above threshold) is represented. The data represent the mean ± SEM for n = 3 studies. (C) Huh-7 cells were treated with vehicle (Veh), 800 µM PA, 400 µM PO plus 800 µM PA, or 400 µM PO alone for 8 hours. SCD-1 mRNA was quantified by real time PCR. Fold induction was determined by normalization to 18S ribosomal RNA. Data represent the mean ± SEM of 3 independent experiments.

