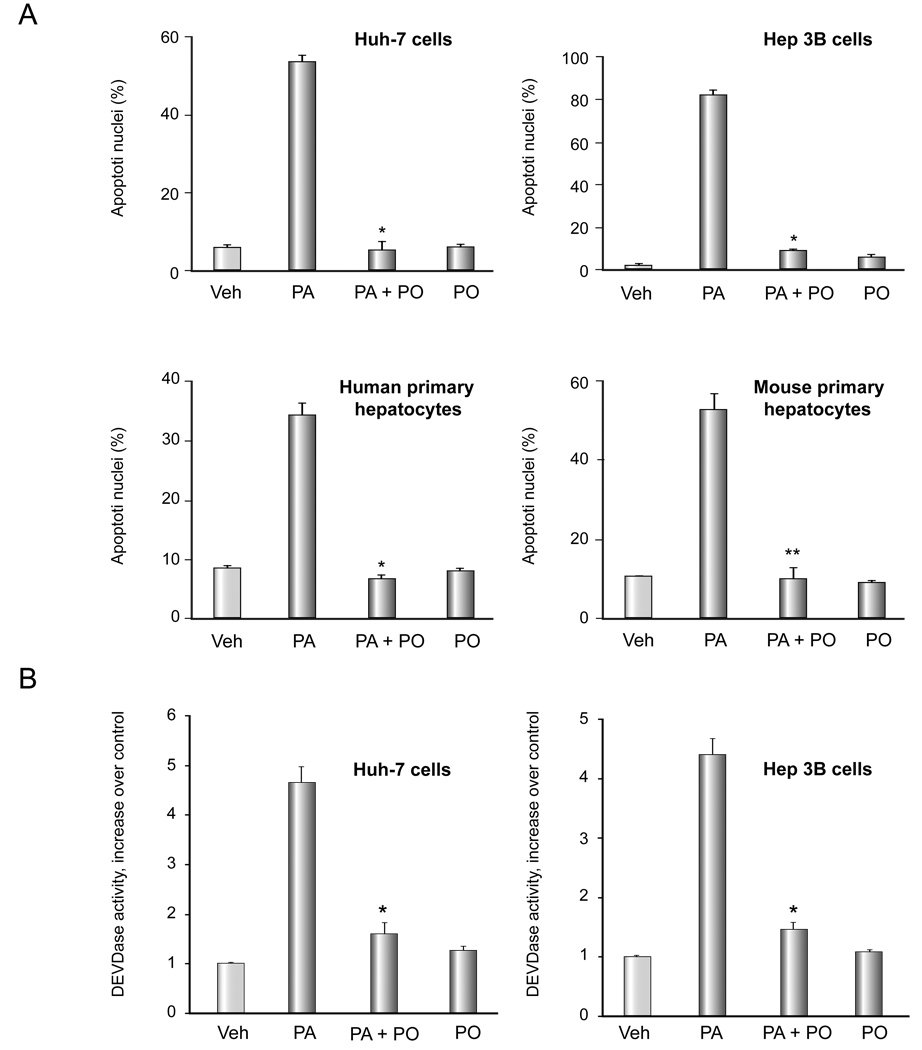
Figure 2. PO attenuates PA-mediated apoptosis.
(A) Cells were treated with free fatty acids. The concentration of PA was 800 µM for Huh-7 cell, 400uM for Hep 3B cells and 200 µM for primary hepatocytes. The ratio of PA: PO was 2:1 for Huh-7 cells and 1:1 for the remainder of the cell types. Apoptosis was assessed by morphological criteria after DAPI staining. The data represent the mean ± SEM for n = 3 studies. * p < 0.01, ** p < 0.05, PA-treated cells vs. PA plus PO-treated cells. (B) After Huh-7 cells were treated as in (A), activity of effector caspases 3 and 7 was measured by a fluorogenic assay. Data are expressed as fold-increase of relative fluorescence units (RFLU) over control value (untreated cells), which was arbitrarily set to 1, and represent the mean ± SEM for n=3 studies each performed in triplicate. * p<0.05, PA-treated cells vs. PA plus PO-treated cells.

