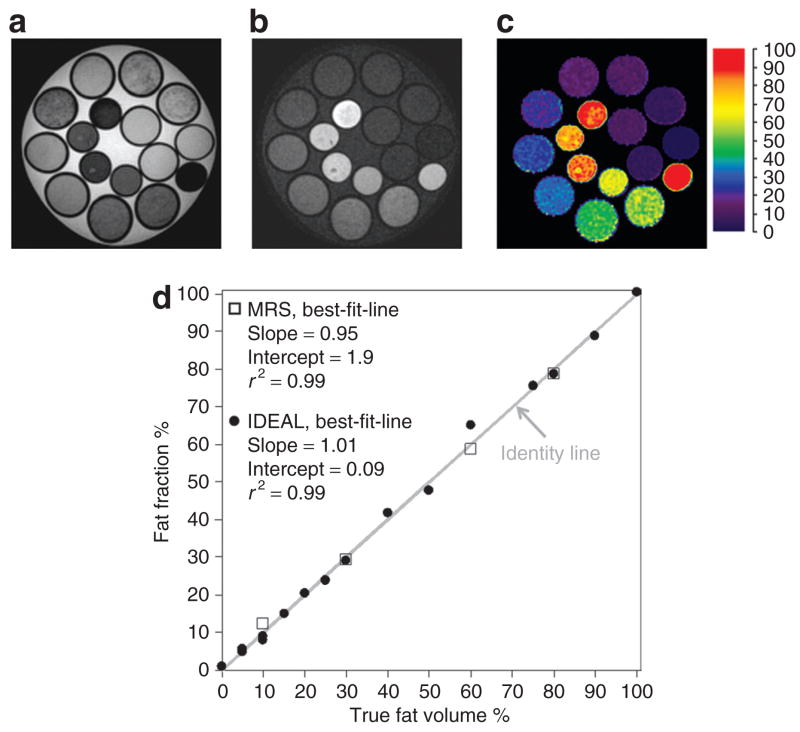
Figure 1.
Results from oil–water emulsion experiment. Reconstructed (a) water, (b) fat, and (c) fat fraction images demonstrate excellent fat and water separation and show clear differences in the amounts of fat and water in each vial. (d) Correlation of true fat volume fraction against the mean fat fraction computed from IDEAL (circle) and MRS (open square) is strong across the full fat fraction range. The best-fit-lines are not shown because they nearly overlap the identity line (gray). Note that water in the bowl is correctly reconstructed to the water image. IDEAL, Iterative Decomposition with Echo Asymmetry and Least squares estimation; MRS, magnetic resonance spectroscopy.

