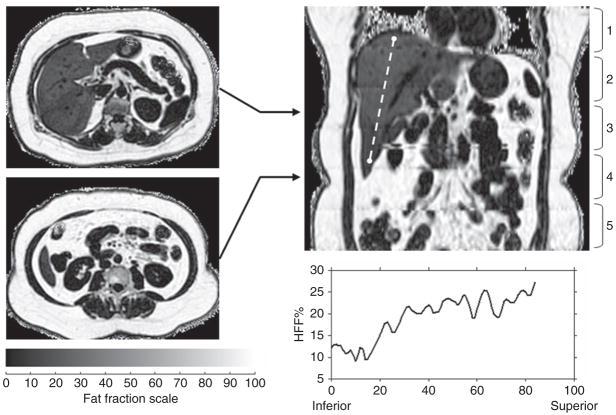
Figure 4.
Single reformatted coronal slice (fat fraction map) from five sets of axial acquisitions, showing contiguous coverage of the whole abdomen. Two source axial images are shown, one at the level of the liver and pancreas, and one at the level of the kidneys. Each axial acquisition was obtained in a 20-s breath-hold, acquiring a small slab as shown along the right. Profile along the dashed white line illustrates nonuniform fat fraction across the liver, highlighting the potential for IDEAL to detect heterogeneous organ fat infiltrations. The profile does not cross any hepatic vascular structures. Note the clear delineation of subcutaneous and visceral adipose tissue depots, along with fat fraction representation of major abdominal organs. HFF, hepatic fat fraction; IDEAL, Iterative Decomposition with Echo Asymmetry and Least squares estimation.

