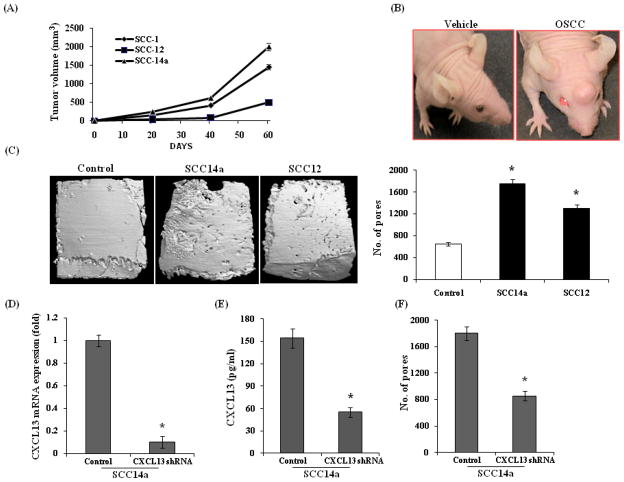
Figure 5.
In vivo model of OSCC tumor invasion/osteolysis in athymic mice. (A) Athymic mice were subcutaneously injected with 7×10⁶ OSCC cells (SCC1, SCC12 and SCC14a) in PBS over calvaria. Tumors were allowed to grow for 4–5 weeks and tumor volumes were measured using vernier calipers (*p<0.05). (B) Athymic mice with vehicle (PBS) control and SCC14a tumor. (C) μCT analysis of calvaria isolated from OSCC tumor-bearing athymic mice. Mice were injected with 7×10⁶ SCC14a, SCC12 and PBS (control) over calvaria was sacrificed after 4–5 weeks and calvaria isolated from these mice were μCT analyzed for osteolytic lesions. (D) Real-time RT-PCR analysis of CXCL13 mRNA expression in control scrambled shRNA and CXCL13 shRNA (SABiosciences, Frederick, MD) knock-down SCC14a cells. Relative mRNA expression level was normalized with respect to GAPDH amplification (*p<0.05). (E) CXCL13 levels in conditioned media (CM) obtained from control and CXCL13 shRNA knock-down SCC14a cells as measured by ELISA (*p<0.05). (F)μCT analysis of osteolytic lesions in calvaria isolated from control and CXCL13 shRNA knock-down SCC14a tumor-bearing athymic mice (*p<0.05).

