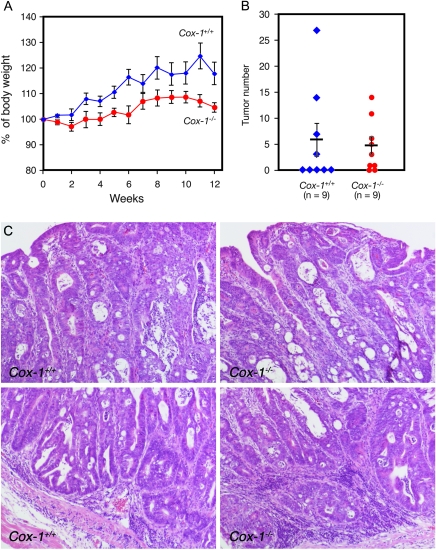
Fig. 5.
AOM/DSS-induced colon tumor formation in Cox-1−/−-knockout mice. (A) Body weight of mice following AOM and DSS administration. (B) Numbers of tumors per mouse in Cox-1−/−-knockout and Cox1+/+ wild-type mice. Vertical bars indicate the mean tumor number and SE. (C) Histological sections of tumors in wild-type Cox-1+/+ (left panels) and Cox-1−/−-knockout (right panels) mice.

