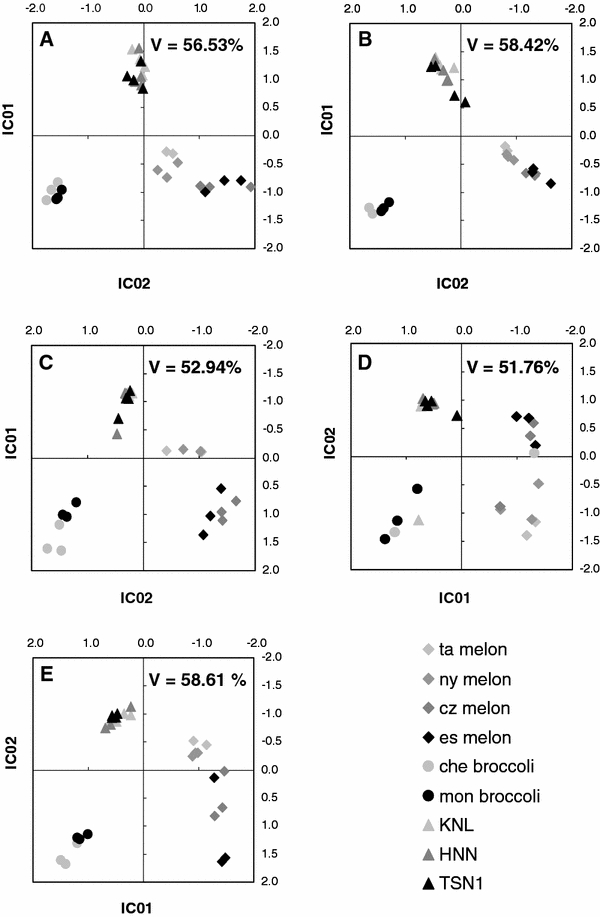
Fig. 1.

Comparative independent component analysis demonstrates the reproducibility of sample discrimination between laboratories and method variations. a–e shows independent component analyses based on the first two principal components of a PCA preprocessing. The visualised percentage of total variance (V) is indicated. a shows data of UMAN after metabolite targeted data processing, method combination [L1] and [M7]. b is based on fingerprinting the data set of UMAN with methods [L1] and [M1]. c compares fingerprinting data of LECO with method [L2.1] and [M1] to GC×GC-fingerprinting data (d) of the same laboratory using method [L2.1 2D] and [M1]. e demonstrates the fingerprinting results of MPIMP using the method combination [L3] and [M2]
