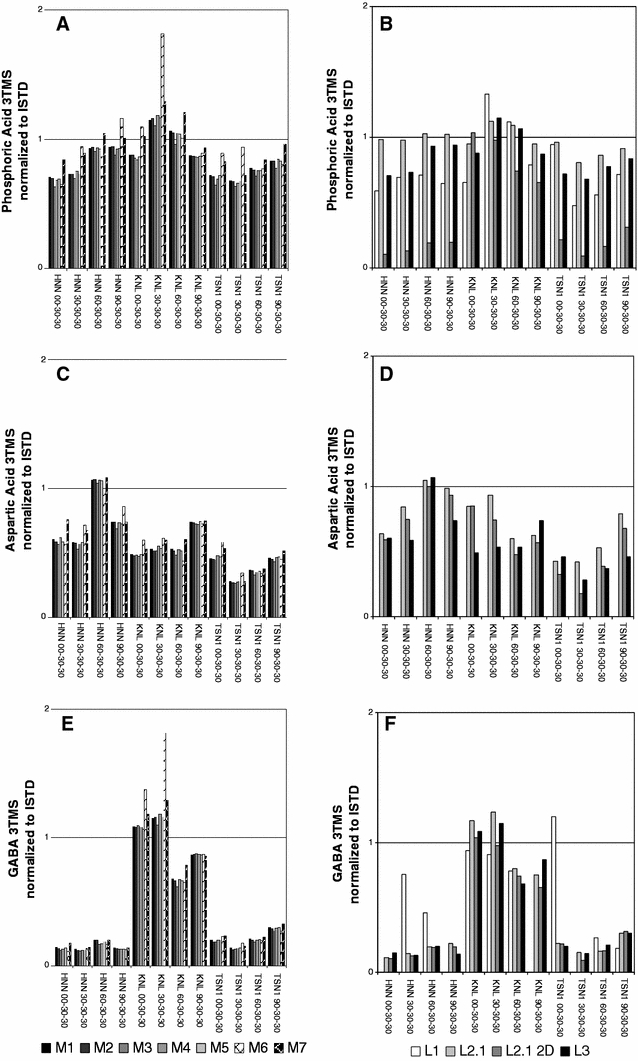
Fig. 5.

Comparisons of endogenous metabolite levels using responses normalised to the d4-succinic acid internal standard. Metabolites were chosen to represent the borderline of potential distinctive features, such as a, b phosphoric acid (3TMS) and c, d aspartic acid (3TMS), as well as clear differences between sample groups, e.g. e, f GABA, 4-aminobutyric acid (3TMS). Variation of processing methods [M1] to [M7] of an identical data set [L3] (a, c, e) is compared to variations between laboratories [L1] to [L3] with processing fixed to [M1] (b, d, f). Abbreviations HNN, KNL and TSN1 represent rice cultivars, numbers encode nitrogen regimes (Sect. 2.1.)
