Figure 2.
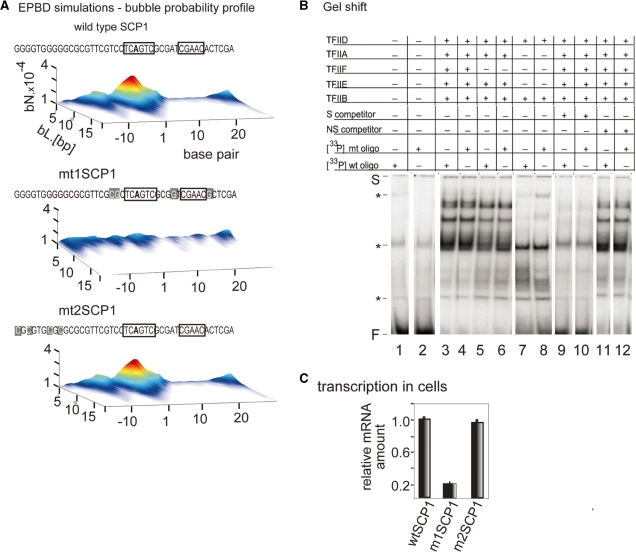
EPBD-derived mutations that change bubble probability profile and transcriptional activity while preserving TFIID complex formation at the SCP1 promoter. (A) Bubble probability profiles of the wild-type SCP1 promoter (wtSCP1), m1SCP1, m2SCP1 mutant variants designed to silence transcription activity without affecting protein-binding sites. The probability (z-axis) for the formation of bubbles of amplitude >3.5 Å with length L (y-axis) beginning at a given nucleotide position (x-axis) relative to the TSS (‘+1’). The wtSCP1, m1SCP1 and m2SCP1 sequences are shown at the top. Mutated residues are indicated with gray boxes. Protein binding sites are indicated with black frames. The profile of m2SCP1 is identical to wild type SCP1 as shown at the bottom. (B) Gel shift reactions. Effect of the m1SCP1 mutations on complex formation between TFIID, TFIIB, TFIIF, TFIIE and the Inr promoter fragment. Band shift reactions received a 33P-labeled, double-stranded oligonucleotide (0.12 nM) containing the wild-type (lanes 1, 3, 5, 7, 9 and 11) and the m1SCP1 Inr box sequence (lanes 2, 4, 6, 8, 10 and 12), as indicated in (A). Transcription factors samples are as follows: lanes 1 and 2 bovine serum albumin; lanes 3–12 received equal amounts (in micrograms) of transcription factors as indicated above the lanes. The reactions in lanes 9 and 10 received 3 nM of homologous wild-type cold SCP1 oligonucleotide as a competitor. The reactions in lanes 11 and 12 received 10 nM of unrelated cold oligonucleotide as a competitor. The presence (+) or absence (−) of competitor oligo DNA and basal transcription factors in the reactions is indicated above the lanes. The positions of the gel shift start (S), the free DNA (F) and the non-specific gel shift products (asterisk) are indicated. (C) Transient cell transfection experiments were carried out to measure wtSCP1, m1SCP1 and m2SCP1 promoter activity. The three pUC119-based constructs (16) (2 µg/106 cells) were transfected by electroporation into HeLa cells. Total RNA was extracted from the cells and subject to Q-PCR-based analysis with pUC119 primers to measure cellular level of promoter-specific RNA transcripts. To ensure equal transfection efficiency, DNA instead of RNA was extracted from an aliquot from each reaction, and subjected to Q-PCR with the same primers. Data are expressed as fold induction relative to wtSCP1 mRNA level (on the vertical); all values are normalized to the cellular reference gene ARPO0 mRNA level of expression; reactions were run in triplicate; results were consistent in four independent experiments; error bars, mean ± SD, n = 4. The normalized values are plotted as a bar graph and the identity of the promoter-specific transcripts level is shown below the bars.

