Figure 3.
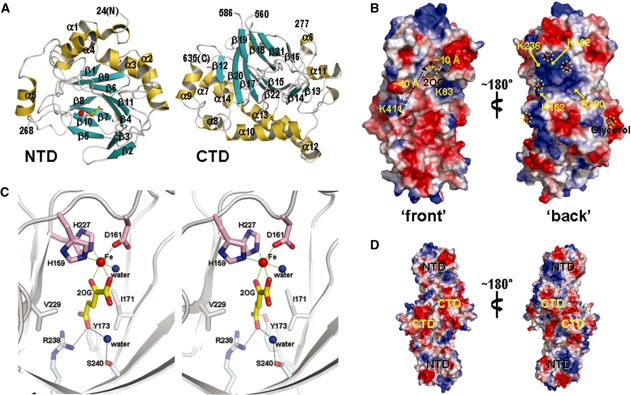
Surface diagram and the active site of S. cerevisiae Tpa1. (A) Ribbon diagram of the Tpa1 NTD (left panel) and CTD (right panel), colored as in Figure 2C and labeled as in Figure 2B. (B) Electrostatic potential at the surface of Tpa1 monomer. Blue and red colors correspond to positive and negative potentials, respectively. The bound 2OG, glycerol and sulfate ions are shown in stick models and are circled. The binding groove is indicated with two orthogonal dotted lines. (C) Stereo view of the active site around the bound iron and 2OG. Red and blue balls represent the iron ion and a water molecule, respectively. Green dotted lines denote the iron coordination. Black dotted lines denote hydrogen bonds. (D) Two different views of the electrostatic potential at the molecular surface of Tpa1 dimer, colored as in Figure 3B.

