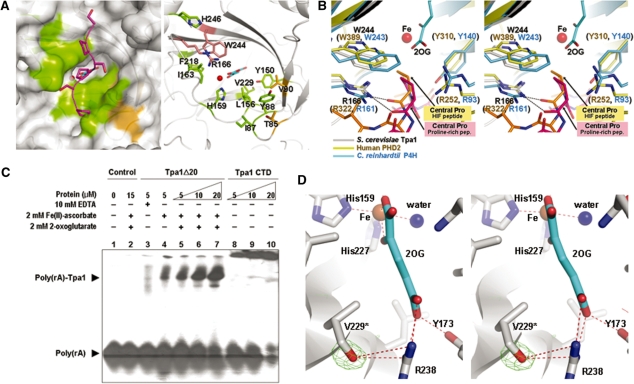
Figure 4.
Structural comparison of Tpa1 and other P4Hs and RNA binding assay. (A) Surface representation (left panel) and ribbon diagram (right panel) of the conserved residues around the active site of Tpa1. The left and right panels are the same view. The left panel shows the (Ser–Pro)5 peptide in a purple stick model after structural superimposition of the algal P4H–peptide complex (PDB code: 3GZE) and S. cerevisiae Tpa1. On the surface representation of S. cerevisiae Tpa1 (left panel), residues conserved among yeast Tpa1, Ofd1 and human Tpa1 are colored in green (Ile87, Tyr88, Tyr150, Leu156, His159, Ile163, Arg166, Phe218, Val229, Trp244, His246); residues conserved between yeast Tpa1 and Ofd1 as brown (Thr85, Val90). In the right panel, potential proline-recognizing residues of S. cerevisiae Tpa1 (Arg166, Trp244) are shown in stick models and colored in salmon. (B) Stereo view of the superposition of S. cerevisiae Tpa1 (gray), human PHD2 (PDB code: 3HQR) (yellow) and algal P4H (PDB code: 3GZE) (blue) around the active site. The HIF-1α peptide from human PHD2 complex and the (Ser–Pro)5 peptide from the algal P4H complex are shown in orange and pink stick models, respectively. (C) Electrophoretic mobility shift assay of S. cerevisiae Tpa1. Poly(rA) is a radiolabeled 20-mer RNA. Poly(rA)-Tpa1 indicates the shifted band. The protein concentration is for bovine serum albumin in lane 2, for Tpa1Δ20 in lanes 3−7 and for Tpa1 CTD in lanes 5−10. (D) Stereo view of the extra electron density around Val229. The averaged kick omit Fo – Fc map was calculated using PHENIX (54) after omitting the hydroxyl group that modifies the side chain of Val229 (contoured at 3.0 σ).

