Figure 1.
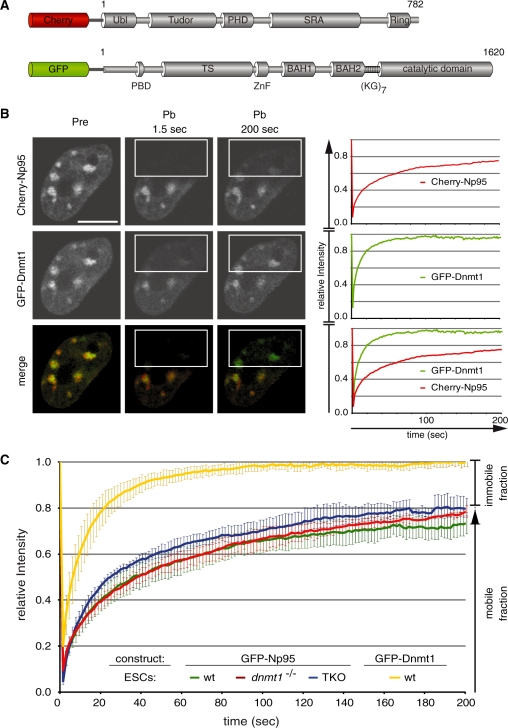
Binding kinetics of Dnmt1 and Np95 in living cells. (A) Schematic representation of Np95 and Dnmt1 fluorescent fusions. Ubl, ubiquitin-like domain; Tudor, tandem Tudor domain; PHD, plant homeodomain; SRA, SET- and Ring-associated domain; Ring domain; PBD, PCNA-binding domain; TS, targeting sequence; ZnF, zinc-finger; BAH, bromo adjacent homology domain; (KG)7, lysine-glycine repeat. (B) Dnmt1 and Np95 display different kinetics. Representative images from FRAP experiments on wt J1 ESCs transiently co-transfected with Cherry-Np95 and GFP–Dnmt1 constructs. Images show co-localization at chromocenters before (Pre) and at the indicated time points after (Pb) bleaching half of the nucleus. Bleached areas are outlined. Corresponding FRAP curves are shown on the right. Bars, 5 µm. (C) FRAP kinetics of GFP–Np95 in J1 ESCs with different genetic backgrounds [wt, dnmt1–/– and dnmt1–/–, 3a–/–, 3b–/– (TKO)]. Kinetics of GFP–Dnmt1 is shown for comparison. Mobile and immobile fractions are indicated on the right. Values represent mean ± SEM.

