
Table 1.
Overview of the effect of mutations in the Apobec3G MAPPIT bait on the interaction with the Apobec3G prey (left) or VifSLQ prey (right)
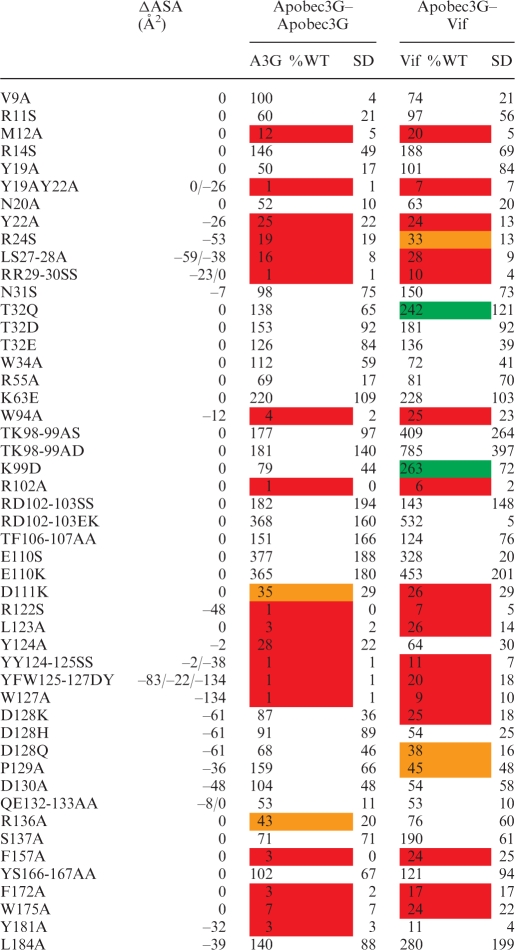 |
MAPPIT luciferase fold inductions for each mutant are expressed as percentage of Wild Type Apobec3G bait. The averages of these percent values of several independent MAPPIT experiments and standard deviation (SD) are shown. Strongly increased or decreased values that are significantly different from the WT in a paired t-test are indicated by a color code. Red and orange indicate a 70 and 50% reduction of the MAPPIT signal; green indicates a >200% increase of the MAPPIT signal. Hek293T cells were transiently co-transfected with plasmids encoding the chimeric Apobec3G WT or mutant Apobec3G bait constructs and Vif or Apobec3G prey constructs, combined with the pXP2d2-rPAP1-luci reporter. The transfected cells were either stimulated for 24 h with Epo or were left untreated (NS, not stimulated). Luciferase measurements were performed in triplicate. Data are expressed as a percentage of the WT fold inductions (stimulated/NS). ΔASA gives the decrease of the water accessibility (in square Angströms) of the mutated residue sidechains upon interaction of two monomers via the head-to-head interface. Residue sidechains that get buried in the interface have a negative ΔASA.