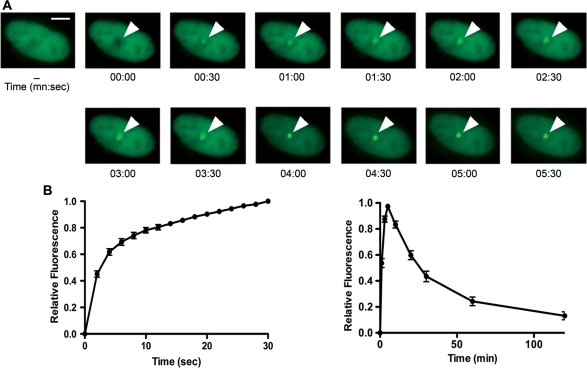
Figure 1.
Recruitment of Exo1 to DNA DSBs. (A) U2OS cells expressing GFP-Exo1b fusion protein were micro-irradiated and images taken at the indicated times after damage. The scale bar represents 5 µm. (B) Graphical representation of Exo1 recruitment to sites of DNA damage from 0 to 30 s after damage induction. (C) Graphical representation of Exo1 recruitment and dissociation from sites of DNA damage from 0 to 120 min after damage induction. The data shown represents the mean and standard deviation (SD) of three independent experiments.

