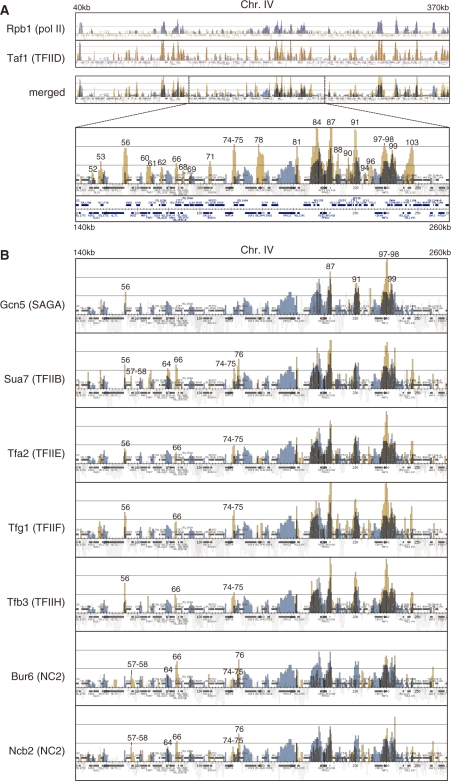
Figure 1.
Localization of general transcription factors (GTFs) and RNA polymerase II (pol II) on chromosomes III, IV and V. (A) Comparison of the localization of Rpb1 (a subunit of pol II, top panel) and Taf1 (a subunit of TFIID, second panel) by combining these two images into one (third panel) denoted as ‘merged’ at left. The strain YTK2741 expressing HA-tagged Taf1 was grown in YPD (yeast extract, peptone, dextrose) medium to mid-log phase at 25°C. Two hours after the temperature shift to 37°C, the cross-linked chromatin was prepared and precipitated with anti-CTD (Rpb1) or anti-HA (Taf1) monoclonal antibodies, and then analyzed by GeneChip (SC3456a 52005F, P/N 520015; Affymetrix). The blue and orange vertical bars represent the significant occupancy by Rpb1 and Taf1 at the region from 40 000 to 370 000 on chromosome IV, respectively. The light gray bars underneath the colored bars (e.g. blue) indicate the signals derived from other-colored factors (e.g. orange) that are not enriched significantly in the immunoprecipitated fraction (49). The horizontal small squares with a different color in each panel indicate the ORFs. The bottom panel represents the enlarged image corresponding to the region from 140 000 to 260 000 of the third ‘merged’ panel. In these ‘merged’ images, the thick colored vertical bars are shown in light colors to increase their transparency. Note that the ORFs are also drawn below the bottom panel as they were partly overlapped by the vertical bars in their original positions. The numbers above the occupancy signals correspond to those in Supplementary Table S3. (B) Comparison of the localization of Gcn5 (a subunit of SAGA, top panel), Sua7 (TFIIB, second panel), Tfa2 (a subunit of TFIIE, third panel), Tfg1 (a subunit of TFIIF, fourth panel), Tfb3 (a subunit of TFIIH, fifth panel), Bur6 (a subunit of NC2, sixth panel) and Ncb2 (another subunit of NC2, bottom panel), with that of Rpb1 by generating merged images of the same region (from 140 000 to 260 000) of chromosome IV as described for Taf1 in (A). The strains YTK6831 (Gcn5), YTK6837 (Sua7), YTK6838 (Tfa2), YTK6839 (Tfg1), YTK6840 (Tfb3), YTK6842 (Bur6) and YTK6843 (Ncb2) were cultured and cross-linked as described in (A). ChIP analysis was conducted as described in (A) except that anti-PK monoclonal antibody was used to precipitate these transcription factors. Note that the localization profile of Rpb1 represented as ‘blue’ signals in each panel is the same as described in A, which was obtained from YTK2741. The complete data sets including Tafs are represented in Supplementary Figures S5–7.

