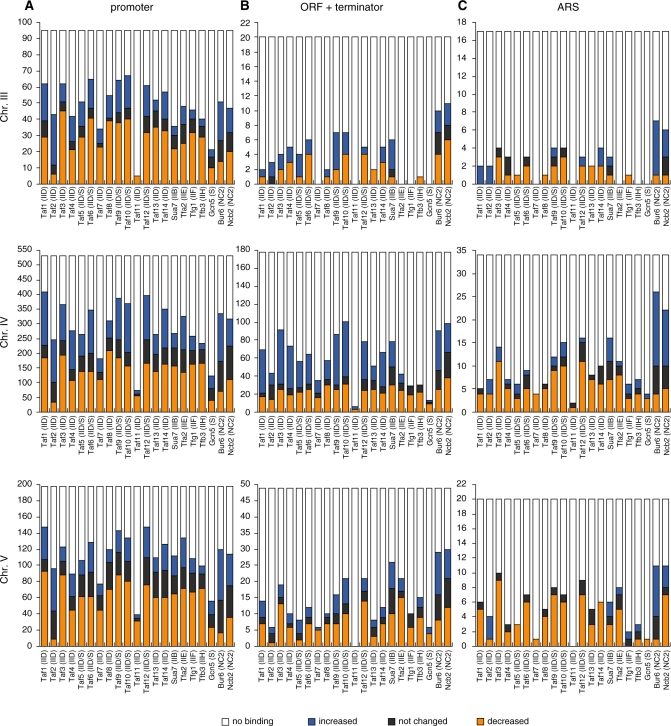
Figure 5.
Effects of taf1-T657K mutation on the number of occupancy sites for GTFs, Tafs, Gcn5 and NC2 on chromosomes III, IV and V. The number (y-axis) of occupancy sites for each factor that is shown below the x-axis (letters inside parentheses are abbreviations that specify originated GTF or complexes; e.g. IIB/D/E/F/H and S refer to TFIIB/D/E/F/H and SAGA, respectively) was counted separately for the promoter regions of class II genes (A), open reading frames (ORF) and the terminator regions of class II genes (B), and autonomously replicating sequences (ARS) (C). The results are summarized for each chromosome: III (top panels), IV (middle panels), and V (bottom panels). In all panels, the occupancy sites are categorized into four groups that are labeled with different colors. Orange, blue and black bars indicate the sites where the occupancy level of a given factor was weakened, strengthened, or not changed, respectively, in taf1-T657K strains when compared with wild-type strains, while white bars indicate the sites that are not bound by a given factor but are bound by one of the other factors shown below the x-axis. These data were originally derived from Supplementary Figures S8–10, and the counting details are summarized in Supplementary Table S3.

