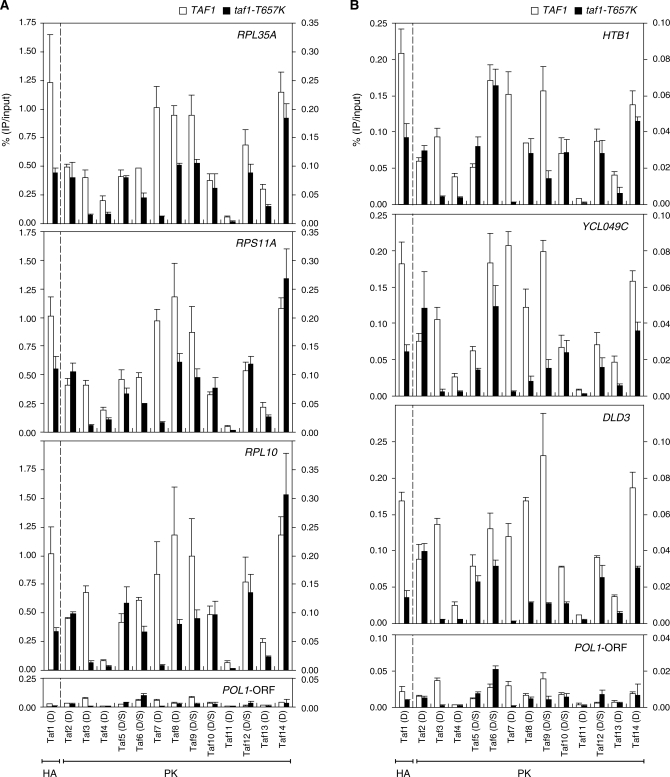
Figure 6.
Effects of taf1-T657K mutation on the occupancy levels of Tafs at a subset of class II gene promoters. (A) Comparison of Taf occupancy at the promoters of three ribosomal protein genes, RPL35A (top panel), RPS11A (second panel) and RPL10 (third panel), or POL1-ORF (bottom panel, negative control) in wild-type (indicated by white bars) and taf1-T657K (indicated by black bars) strains. ChIP analysis was conducted as described in Figure 2 using the same set of strains described in Figure 4. Quantitation of DNA that was recovered after the immuno-precipitation was performed as described in Figure 2. The data from three independent experiments are presented as mean ± SD. Note that the left and right y-axes are scaled differently to better display the data for Taf1 (obtained using an anti-HA monoclonal antibody) and the other Tafs (obtained using an anti-PK monoclonal antibody) in the same panel. Thus, each panel is divided into two parts by a broken vertical line. (B) Comparison of Taf occupancy at the promoters of the other three class II genes, i.e. HTB1 (top panel), YCL049C (second panel) and DLD3 (third panel), or POL1-ORF (bottom panel, negative control) in wild-type (white bars) and taf1-T657K (black bars) strains. ChIP and DNA quantitation were performed as described in (A). Note that the data for POL1-ORF are the same as those in (A) but shown here on a different scale for comparison with the data for HTB1, YCL049C and DLD3.

