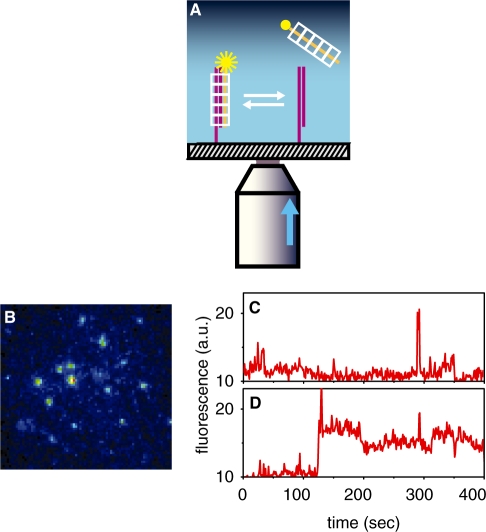
Figure 1.
Experimental scheme for observing individual synapses and sample results. (A) Fluorescently-tagged ssDNA–RecA complexes are observed only when forming synaptic intermediates with dsDNA anchored on a glass surface. The exponentially decaying evanescent light produced by a narrow laser beam (entering a high numerical aperture objective off-axis as illustrated by the arrow), illuminates only a ∼200 nm thick layer above the glass. (B) Snapshot of synaptic intermediate complexes, ∼25 µM across. (C) Fluorescence versus time of a single synapse formed with a fully heterologous, 50-bp-long ssDNA–RecA complex, or (D), with a fully homologous ssDNA–RecA complex. Traces and snapshot represent raw, unfiltered data.

