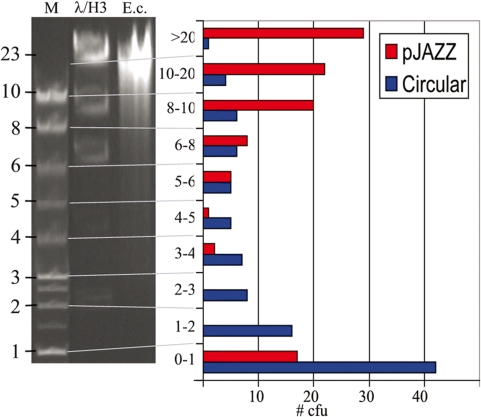
Figure 5.
Minimal size bias in the pJAZZ vector. HMW E. coli genomic DNA was hydrodynamically sheared to ∼8–20 kb. One aliquot was visualized on a gel (lane ‘E.c.’), along with a 1-kb size marker (‘M’) and a HindIII digest of lambda DNA (‘λ/H3’). Another aliquot was cloned without size selection into the pJAZZ-OC vector or pUC19. Clones from each library were randomly isolated for analysis of insert size. The bar graph depicts the number of inserts of each size. The size distribution of pJAZZ clones corresponds to that of the input DNA.

