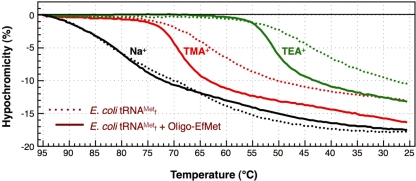
Figure 3.
Hypochromicity profiles of E. coli
 in the presence or absence of the complementary oligoDNA, Oligo-EfMet, in buffers containing various monovalent cations, Na+, TMA+ or TEA+. The dotted and solid lines show the hypochromicity profiles of E. coli
 alone and the same tRNA with its complementary oligoDNA, Oligo-EfMet, respectively.

