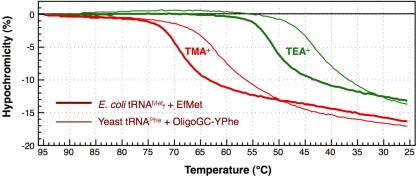
Figure 7.
Differences in the hypochromicity profiles between E. coli
 and yeast tRNAPhe with their complementary oligoDNAs in hybridization buffers containing tetra-alkylammonium ions. The thick lines show the hypochromicity profiles of E. coli
 with its complementary oligoDNA, Oligo-EfMet, in hybridization buffer TMA+ or TEA+. The thin lines show the profiles of yeast tRNAPhe with one of its complementary oligoDNAs, OligoGC-YPhe. The red and green lines show the profiles in hybridization buffer TMA+ containing TMA-Cl and hybridization buffer TEA+ containing TEA-Cl, respectively.

