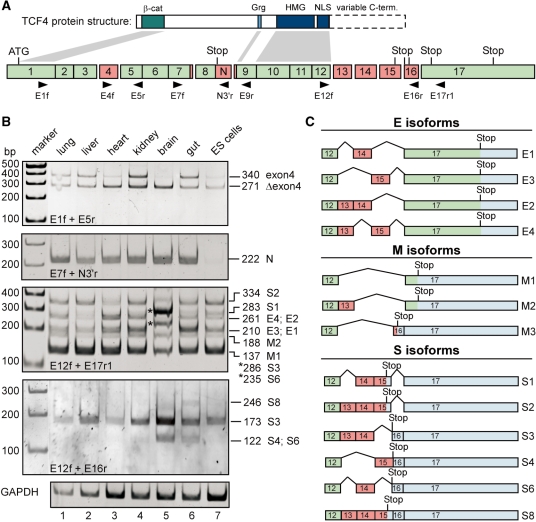
Figure 1.
Comparison of expression patterns of TCF4 splice variants in mouse tissues and ES cells. (A) Simplified structural schemes for TCF4 proteins (top) and the mouse Tcf7l2 gene (bottom). The Tcf7l2 gene consists of 17 exons, some of which are subject to alternative splicing (exons 4, 13–16; labelled in red). Constitutive exons are labelled in green. Additional variation of Tcf7l2 mRNA sequences is generated due to the use of alternative splice acceptor and donor sites, respectively, in exons 7, 8 and 9. Affected regions are also indicated by red boxes. The position of the start codon in exon 1 is marked. Which of the potential stop codons following exon 8 or within exons 15, 16 and 17 is used, depends on the particular exon combination present in the final mRNA. Retention of sequences following exon 8 (labelled N) in the final mRNA generates the TCF4N variant. Exon lengths are drawn approximately to scale. Horizontal arrowheads indicate the positions and the orientation of primers used in RT-PCR reactions. Some of the structural features of TCF4 proteins are indicated and linked with connectors to the exons by which they are encoded. Dashed lines skirt the highly variable C-terminal parts of TCF4 derived from exons 13–17. β-cat: β-catenin binding domain; Grg: binding motif for groucho-related gene (Grg) products (73); HMG: HMG box; NLS: nuclear localization signal. (B) Expression analyses of TCF4 splice variants in different mouse tissues and ES cells. Upon isolation of RNA from mouse ES cells and tissue samples from 3-days-old mice, cDNA was synthesized, and TCF4 splice variants were amplified by PCR using exon-specific primer combinations as indicated. Amplification of GAPDH sequences served to control RNA and cDNA integrity. PCR products were separated by gel electrophoresis, and visualized by ethidium bromide staining. To determine the exon combination represented by the various DNA fragments, PCR products were subcloned and sequenced. The deduced size of the PCR products and their assignment to TCF4 E, S and M groups of splice variants is indicated on the right side of the panels. PCR products from brain tissue labelled by asterisks represent isoforms S3 and S6. (C) Summary of the C-terminal TCF4 splice variants identified. Red exons are alternatively spliced whereas green exons are constitutively used. Blue areas indicate untranslated regions. Positions of stop codons used are shown. Splice variants were grouped depending upon whether the resulting translation products contain no C-clamp or complete and incomplete versions thereof, respectively (Figure 2). Accordingly, the isoform formerly denoted S5 (26) was reclassified as M3.

