
Figure 8.
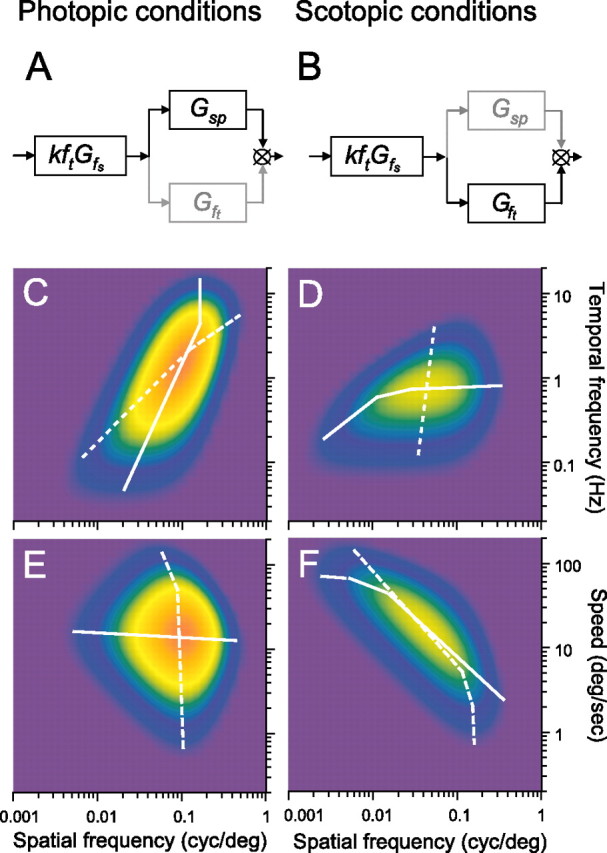
Schematic diagram of the linear model indicating the shift in tuning preference under photopic (A) and scotopic (B) conditions. Contour plots of the contrast sensitivities of wild-type C57BL/6J mice computed with Equation 2 for rotating gratings of different spatial and temporal frequencies under photopic (C, E) and scotopic (D, F) conditions (Table 1 parameters). Color scale from blue to orange encodes contrast sensitivity from low to high. White lines plot maximal sensitivities at constant temporal (dashed) and spatial (continuous) frequencies in C and D and maximal sensitivities at constant speed (dashed) and spatial frequency (continuous) in E and F.