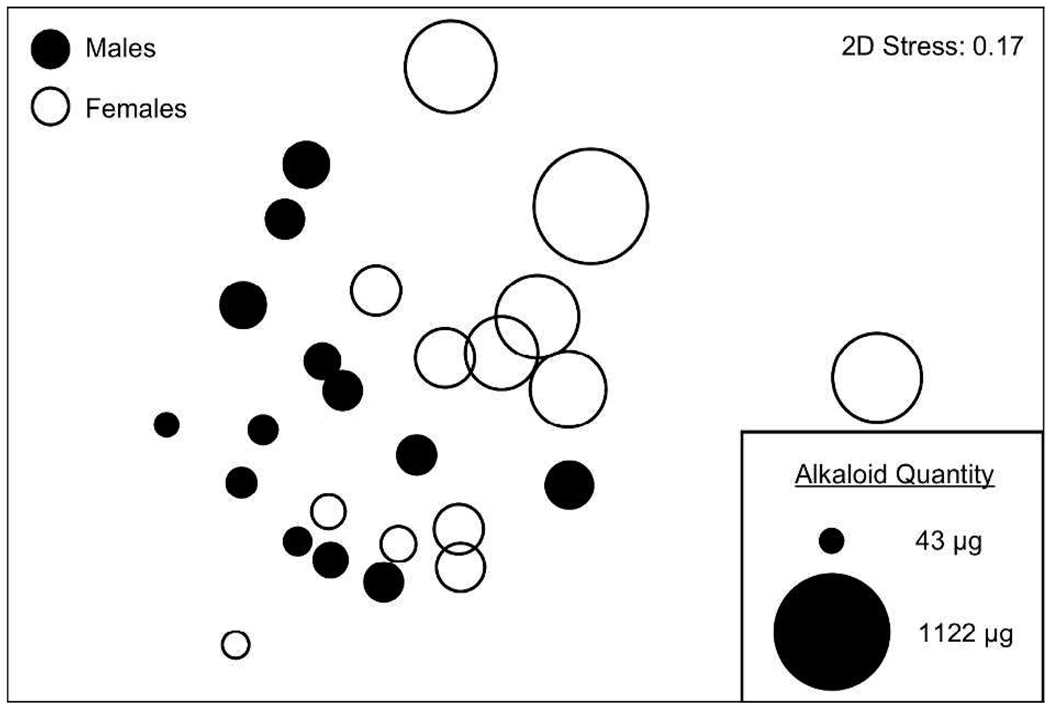
Figure 4.
nMDS plot of alkaloid composition between males and females of Oophaga pumilio from Cayo Nancy, Bocas del Toro, Panama. Each circle represents an individual male or female frog, and the distance between symbols represents the difference in alkaloid composition. The diameter of each circle is directly equivalent to the quantity of alkaloids present in that frog (µg per frog skin).

