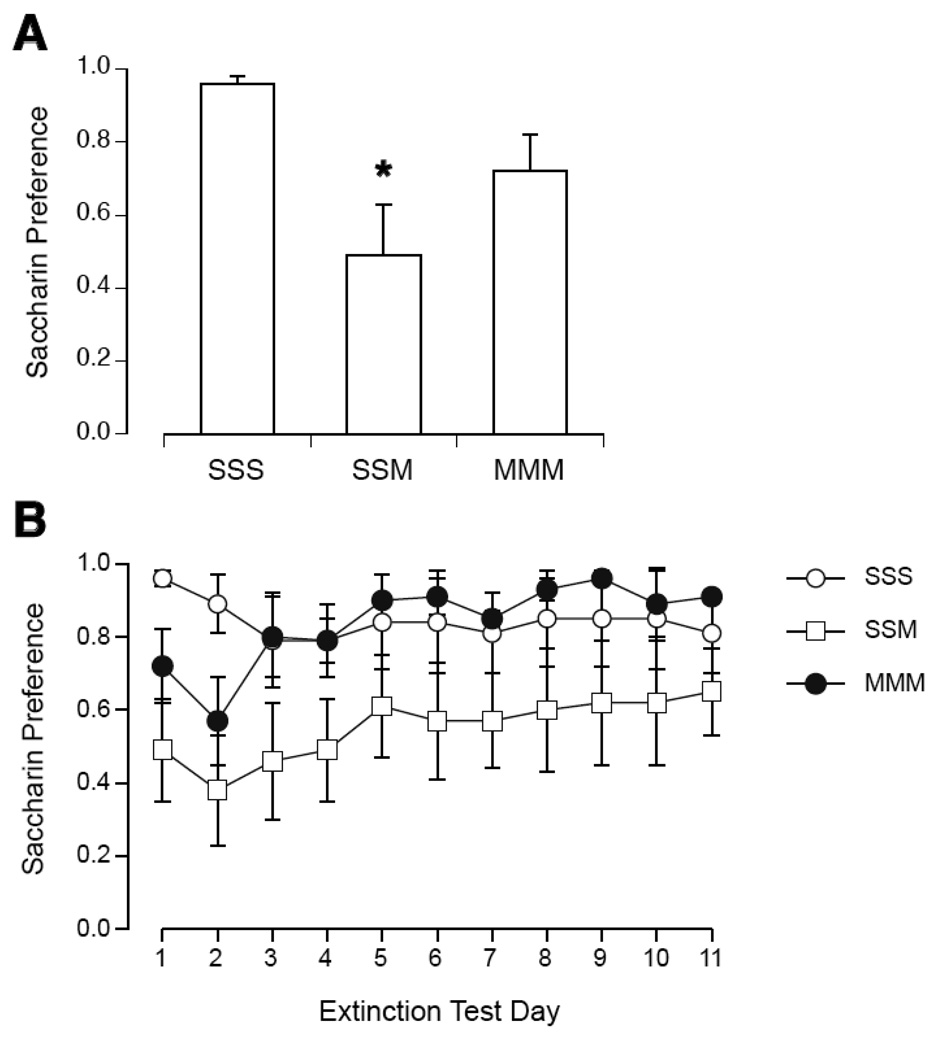
Figure 2.
Initial magnitude (A) and extinction (B) of CTA expressed as saccharin preference during 2-bottle tests in rats after repeated sham or magnet exposure on 3 consecutive days. On the third day, intake of saccharin was paired with sham exposure (group SSS) or magnet exposure (SSM and MMM). After the first 2-bottle test (A), only SSM rats showed a significant decrease in saccharin preference compared to SSS rats. Across extinction days (B), only on day 2 did MMM rats show a significantly lower preference than SSS rats. *p < 0.05 vs. SSS preference.

